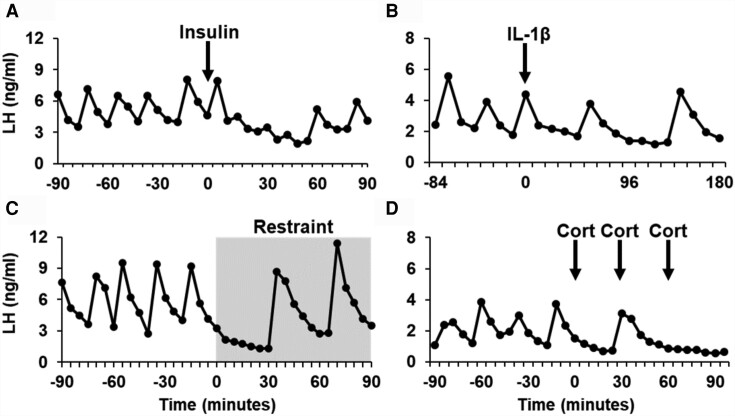
Figure 1.
Comparison of luteinizing hormone (LH) profiles in mice treated with A, insulin; B, interleukin 1β; C, physical restraint; or D, corticosterone. Blood samples were collected from ovariectomized (insulin, interleukin 1β, restraint) or estrogen-treated ovariectomized (cortisol; Cort) mice before and after exposure to a stressor or a stress level of corticosterone (34, 85, 87, 88). Blood samples were analyzed at the University of Virginia assay core or an inhouse assay developed in our laboratory (89). Panels A, C, and D were originally published in refs. 34, 85, and 108 and has been adapted and reproduced by permission of Oxford University Press (http://global.oup.com/academic). Panel B was originally published in ref. 106 and has been adapted and reproduced by permission of Bioscientifica (https://www.bioscientifica.com/publishing/journals/).

