

Abstract
Aims:
The central nervous system (CNS) regulates lower urinary tract reflexes using information from sensory afferents; however, the mechanisms of this process are not well known. Pressure and volume were measured at the onset of the guarding and micturition reflexes across a range of infusion rates to provide insight into what the CNS is gauging to activate reflexes.
Methods:
Female Sprague Dawley rats were anesthetized with urethane for open outlet cystometry. A set of 10 infusion rates (ranging 0.92–65.5 mL/h) were pseudo-randomly distributed across 30 single-fill cystometrograms. Bladder pressure and external urethral sphincter electromyography were used for the determination of the onset of the micturition and guarding reflexes, respectively. The bladder volume at the onset of both reflexes was estimated from the total infusion rate during a single fill.
Results:
In response to many single-fill cystometrograms, there was an increased volume the bladder could store without a significant increase in pressure. Volume was adjusted for this effect for the analysis of how pressure and volume varied with infusion rate at the onset of the micturition and guarding reflexes. In 25 rats, the micturition reflex was evoked at similar volumes across all infusion rates, whereas the pressure at micturition reflex onset increased with increasing infusion rates. In 11 rats, the guarding reflex was evoked at similar pressures across infusion rates, but the volume decreased with increasing infusion rates.
Conclusions:
These results suggest that the CNS is interpreting volume from the bladder to activate the micturition reflex and pressure from the bladder to activate the guarding reflex.
Keywords: bladder, mechanoreceptors, micturition, neural accommodation, neurourology, reflex threshold
1 |. INTRODUCTION
It is important to understand how the central nervous system (CNS) organizes reflex control of the lower urinary tract (LUT) to help identify disease etiology and develop new therapies. The reflexes mediated by bladder afferents (sensory neurons) have been shown to contribute to both continence and voiding. During storage, low-frequency firing of the bladder afferents tonically activates somatic efferents (motor neurons) in the pudendal nerve to excite the external urethral sphincter (EUS).1,2 This reflex, known as the guarding reflex, promotes continence by increasing urethral resistance to flow. As the bladder continues to fill, bladder afferents fire at higher frequencies, signaling sensations of bladder fullness to supraspinal centers.3 In awake humans and animals, forebrain circuits gate micturition, such that micturition occurs when it is contextually appropriate to pass urine.4 In the anesthetized case, voluntary control of the micturition reflex is masked5 such that micturition reflex bladder contractions occur once the reflex circuit is engaged. However, how the CNS uses information transmitted by afferents to execute reflex activation is not known.
Evoking pelvic afferent discharge is dependent on the state of the bladder such that the micturition reflex, for example, has been described as having a pressure or volume threshold for activation.6,7 Mechano-sensitive afferents respond to distension in the bladder wall, which in in vivo investigations is most often defined as intramural tension.8 We can compute this intramural tension (T) through Laplace′s Law, which assuming the bladder is a thin-walled sphere, is defined as
| (1) |
where is the transmural pressure difference across the bladder wall, is the fluid volume in the bladder, and is the bladder wall thickness.7,8 From Laplace′s Law, we expect pressure to have greater correlations to afferent activity than volume does (since tension is directly proportional to pressure), which is substantiated by in vivo data.7–9 However, recent evidence suggests that bladder afferent activity is correlated with intravesical volume.10 As intravesical volume increases, the bladder exhibits increasingly complex pressure responses (marked by high-magnitude bladder pressure derivatives) that coincide with proportional bursts of afferent firing.10 These complex pressure responses or nonvoiding contractions (NVC) were observed to evoke larger changes in afferent activity than general changes in intravesical pressure from baseline.10 As filling progresses, the frequency of NVC increases,11 which implies that at higher bladder volumes increased frequency of NVC would elicit a large afferent response proportional to bladder volume, signaling to the CNS a state of bladder fullness.10 Determining if the CNS gauges volume or pressure to elicit reflex contractions will help us understand how the CNS determines when reflex activation is appropriate.
Here we investigate how varying bladder distension rates affect the volumes and pressures at which the micturition and guarding reflexes activate during cystometry in anesthetized rats. To characterize these relationships, bladder infusion rates were systematically varied across a wide range, from physiologically plausible, to the typical experimental rates, to extremely supraphysiological, while recording bladder pressures and external sphincter electromyography to identify reflex onset.
2 |. MATERIALS AND METHODS
2.1 |. Experimental protocol
All procedures were approved by the Institutional Animal Care and Use Committee (IACUC) of Florida International University. A total of 31 female Sprague Dawley rats (287 ± 28 g, 104 ± 15 days old, Charles River,) were sedated via inhalation of isoflurane followed by a subcutaneous injection of urethane (1.2 g/kg s.c.). The induced depth of anesthesia was assessed every half hour through foot withdrawal reflex.5 In the absence of an evoked response, surgery was started, otherwise additional doses (0.1 g/kg, s.c.) were given at 30-min intervals until cessation of the foot withdrawal reflex. Animals were euthanized following all experiments in accordance with the IACUC protocol.
Surgery began 1.76 ± 0.46 h after the initial injection of urethane. A catheter (PE-90) was placed through the dome of the bladder and secured with suture. A solid-state pressure transducer (sampled at 100 Hz, model, Millar) was threaded through the catheter such that the sensor was positioned just inside the bladder lumen. The catheter was in series with an automated infusion pump (Elite 11, Harvard Apparatus) fitted with a 60 mL syringe. The pump was controlled by computer command to infuse room temperature 0.9% saline into the bladder. Two silver electrode wires were stripped at each end and inserted percutaneously into the EUS for electromyography (EMG, sampled at 4000 Hz, bandpass filtered at 100–3000 Hz, and 1000× amplification). The rat lay prone with the urethral meatus over a collecting cup mounted onto a force transducer (sampled at 200 Hz, 100× amplification, Fort 100G, World Precision Instruments). All data were recorded through a PowerLab 16/35 system (ADInstruments).
To assess the effect of infusion rate on the activation of the micturition and guarding reflexes, the infusion rates tested needed to be defined. Fraser and colleagues described a typical range of infusion rates for rat cystometry as 2.4–10.8 mL/h, which produces physiological tensions during filling.12 This range was divided in time evenly into seven rates that spanned 2.4–10.8 mL/h. From preliminary experiments, the three lowest infusion rates were indistinguishable from each other, so two were dropped. The rates suggested by Fraser and colleagues12 are higher than the natural infusion from the kidneys which occurs intermittently and through peristalsis of the ureters. For rats, natural rates of diuresis (the average amount of fluid input from the ureters into the bladder per hour) have been reported between 0.4 and 1.5 mL/h.13,14 The rates 0.92 and 1.3 mL/h were continuations of the calculations made to evenly distribute the physiological rates with time, and were predicted to last approximately 15 and 30 min during the filling phase (predicted times were used to prevent the experiment from lasting longer than the anesthesia). Four additional rates that were higher than the physiological range were added to maximize the span of infusion rates to fully characterize the effect on reflex activation. In total, 11 of these predefined rates were tested in the study. The infusion rates used are reported in Table 1.
TABLE 1.
Infusion rates used in the study.
| Predefined infusion rates (mL/h) |
Relative infusion rates |
|||||||||||||||
|---|---|---|---|---|---|---|---|---|---|---|---|---|---|---|---|---|
| Natural | range | Suggested range for rat cystometry | Above the range for typical rat cystometry | %(BC/5 min) | ||||||||||||
|
| ||||||||||||||||
| Group | ||||||||||||||||
| 1 (n = 5) | 2.4 | 3.93 | 5 | 6.86 | 10.8 | 25 | 75 | 125 | 175 | 225 | ||||||
| 2 (n = 4) | 3.93 | 5 | 6.86 | 10.8 | 16.2 | 21.6 | 75 | 125 | 175 | 225 | ||||||
| 3 (n = 9) | 0.92 | 1.3 | 10.8 | 16.2 | 21.6 | 32.7 | 65.5 | 125 | 175 | 225 | ||||||
| 4 (n = 7) | 2.4 | 3.93 | 5 | 6.86 | 10.8 | 32.7 | 65.5 | 125 | 175 | 225 | ||||||
Note: Animals were divided into four groups to expand the sampling of infusion rates. Selected infusion rates were from the natural range (0.4–1.5 mL/h),13,14 suggested range (2.4–10.8 mL/h),15 extreme range (>10.8), or relative rates derived from the BC estimation (BC/5 min).
Abbreviation: BC, bladder capacity.
Additionally, it was expected that the bladder size would vary between animals. To account for this, relative infusion rates were calculated from the approximate bladder capacity (BC) such that the relative infusion rates would span the range of physiological rates described above. Following surgery, there was an ~2 h period before data collection to allow the bladder to recover. During this time, we ran 3–5 cystometrograms (CMG) only to estimate BC. For the BC estimation, CMGs were separated by a 20-min break to afford the bladder more rest before data collection. BC was calculated as the sum of the voided volume and the residual volume . The was measured from the force transducer time series (5th order Butterworth filter with 2 Hz cutoff) as the difference in the median volume 10 s before and 10 s after a voiding event. The remaining fluid in the bladder was measured by withdrawal through a syringe and recorded as the . A corrective factor of 0.19 mL was added to the average BC to account for the BC drift that was observed during preliminary experiments. The average BC was used to establish a base relative infusion rate that was predicted to take 5 min to produce a void (BC/5 min; see Table 1).
Animals were in one of four groups (see Table 1), where each group was exposed to a different set of 10 infusion rates. This was done to observe effects from the widest possible range of rates across the entire study while still permitting multiple replicates of the same rate for each animal in individual experiments. The infusion rates were sampled from the predetermined set, according to their group, that spanned natural renal filling, suggested cystometric experiment filling,12 and supraphysiological rates (Table 1, predefined rates). Additionally, for each animal, infusion rates were included based on preliminary BC trials (Table 1, relative rates) to ensure we did not have a fast-fill bias for large bladders or a slow-fill bias for small bladders.
Data collection started ~3 h after the last urethane injection. In an individual experiment each of the 10 infusion rates were in at least 3 trials (a trial being a single fill-to-void CMG) such that an experiment contained at least 30 trials. Trials were divided into six sessions having five trials each. Sessions were separated by 15 min rest because populations of mechanoreceptors in the urethra exhibit less excitation with repeated stimuli; an effect that lasts about 15 min.16 Breaks between trials within the same session were ~1 min but varied slightly according to the length of time required to collect the , or when the postvoid EUS EMG activity had abated. During an experiment with a single animal, the group-defined infusion rates (mixture of relative and predefined rates) were pseudo-randomly ordered such that each infusion rate occurred once every two sessions.
2.2 |. Data analysis
The time of the micturition reflex was determined by the moment when bladder pressure transitioned from a gradual, linear increase to a sharp increase caused by a distension-evoked contraction of the bladder. The pressure time series was reduced to a series of regression lines that were fit from the start of infusion to the peak pressure marking the beginning of a voiding event. This analysis was done using the MATLAB (R2021a) function findchangepts.
The guarding reflex exhibits two characteristic activations of the EUS: a small increase in activity during filling, and a large contraction in response to the bladder contracting during the micturition reflex.17 The tonic activation of the EUS is representative of continence mechanism whereby increased distension in the bladder activates a spinal pathway which excites the EUS to reinforce the urethral seal (Figure 1A).17 This tonic activation of the EUS during filling is not always present in rats, with authors reporting it only in a minority of animals.6,17 The onset of the guarding reflex (tGR) was identified as an abrupt change in the moving mean of the processed EMG signal (4th order Butterworth, 100 and 400 half power frequencies, rectified with outlier removal and smoothed). Animals, where there was tonic guarding during filling, were the focus of the analysis (n = 11). The EUS EMG signal identified as guarding required a signal-to-noise ratio ([mean signal—baseline signal mean]/standard deviation of baseline signal) >1 for inclusion in the analysis.
FIGURE 1.

Identifying the onset of lower urinary tract reflexes. (a) The onset of the guarding reflex (tGR) was determined from the external urethral sphincter (EUS) electromyogram (EMG) time series signal. Here we observe tonic activation of the EUS, as a change in moving mean from the baseline activity (time ~ 0–115 s) at tGR (red circle). Changes in the moving mean are represented as black dashed lines. This was a typical example where the EMG response increased to a tonic activation. (b and c) The time of the micturition reflex () was determined as the moment when bladder pressure transitioned from a gradual, linear increase to a sharp increase caused by a distension-evoked contraction of the bladder (green circle). The filling phase was divided into linear fits. In (c), there are three lines, the first line is a continuation of the line shown in (b) which connects the start of infusion from the pump to . The second line connects to the rising pressure, and the third line connects to the contraction pressure. The line connections are highlighted by the black dotted lines.
Identifying the volume at and required that volume was tracked through the filling and voiding phase. In open cystometry, fluid infused into the bladder is measured in the or the . Since the ureters were not ligated, they account for a small amount of the total bladder volume, whereas the majority of the bladder volume is from controlled infusion from the pump. We may write the volume balance described above as , or the and together (both measured), must equal the experimentally infused volume and the volume from the ureters (allowing us to solve for ).18 The average total infusion rate is then , where is the total trial time. We estimate the bladder volume at any time in the trial as ,18 thus allowing us to compute and . Trials were removed from the data set when the computed rate of ureter infusion was outside the range of 0–2 mL/h, that is, a large plausible upper bound and a lower bound that preserves conservation of volume (178/974 observations).
Animals were excluded from the analysis if there was a failure to establish stable voiding (n = 6), that is, the bladder was contracting during rest periods when no fluid had been infused into the bladder, which may have resulted from bladder irritation during surgery.
To normalize pressures and volumes across animals and across infusion rates, each volume and pressure variable was normalized by
| (2) |
where is the normalized value, is volume or pressure, and is the mean of that variable at an infusion rate of 10.8 mL/h. This normalization accounts for the fact that animals may have different bladder capacities. The infusion rate 10.8 mL/h was selected as the common fill rate between all groups, because the predicted response was that the resulting pressures and volumes at the micturition and guarding reflexes would be (1) quantitatively similar to the extreme infusion rates—at least more so then the smaller magnitude infusion rates; and (2) it would (as a constituent of the “physiological range”) have similar pressures and volumes at micturition and guarding reflexes as lower magnitude infusion rates.
The effect of infusion rate was assessed using an analysis of variance (ANOVA) for normal (sANOVA), heteroscedastic (Welch′s ANOVA or wANOVA), or when the normality assumption was egregiously violated a robust ANOVA with bootstrapping for trimmed means (rANOVA). Data were transformed logarithmically (log base e) unless otherwise stated. Simple linear regression was used to evaluate trends when appropriate, otherwise, Theil–Sen robust regression was used.
3 |. RESULTS
We varied the rate we infused saline into the bladder to determine how it affects activation of the micturition and guarding reflexes. In each fill-to-void trial, we infused the bladder at a constant pseudo-randomly selected infusion rate. We identified the pressure and volume at the onset of the micturition and guarding reflexes and compared how the volume and pressure varied with infusion rate.
3.1 |. Repeated filling and voiding cycles increased BC
We found that the BC increased throughout each experiment without a complementary increase in bladder pressure, and that this effect translated to increased and (Figure 2). The change in volume and pressure with each trial (trial-effect) was quantified with Theil–Sen regression. The across-study volume change per trial was significant (One sample Wilcoxon signed rank, p < 0.001, Figure 2D), which resulted in a 105% increase in over 30 trials. The mean slope for the pressure change per trial was not technically statistically significant (One-sample t-test, p = 0.053, Figure 2F), and resulted in a 13% change in over 30 trials, which suggests that if there is an actual effect that it is small.
FIGURE 2.

Bladder capacity increased throughout the example experiment. (a–c) A typical experiment where the volume at micturition threshold increased over the course of the experiment, and the pressure at micturition threshold remained within a narrow range. The experiment was divided into six sessions of five trials. Between voids of the same session there was a brief rest (56 ± 30 s) to empty the bladder or wait for the postvoid electromyogram (EMG) activity to subside. Between each session was a 15-min break shown in (c) as black (start of session) and red (end of session) dashed lines. (a) increased over the course of the experiment, and the (b) remained approximately constant. (c) The infusion rates are randomly distributed across an experiment (color). For every animal, the order of infusion rates was randomized such that animals that experienced the same group of infusion rates, were exposed to the infusion rates in different orders. (d and e) The distribution of the change in per trial (d) and time (e). The mean slope for the time effect of volume was different from zero (One-sample t-test, p < 0.001). (f and g) per trial (f) and time (g) across the study. The mean slope for the time effect of pressure was not different from zero (One-sample t-test, p = 0.10). Statistical outliers in (d–g) are represented as dots and statistical significance indicated with an asterisk. (h and i) The effect of repeated trials averaged across the study. Each point is the average or across animals (n = 25) for the kth trial. Data are averaged across all animals for kth trial because trials could be averaged in a straightforward way (as compared to experiment time). The volume (a) and pressure (b) for the example experiment are summarized across all animals in (f) and (g), respectively.
The trial effect was not different across infusion rate groups (wANOVA, F = 0.67, p = 0.59) indicating that the volume changes were independent of infusion rate. To investigate the physiological quantities that are invariant at the onset of LUT reflexes, we removed the confounding “trial effect” because BC steadily increased through time regardless of which infusion rates were presented. We adjusted for the trial effect with a linear model, , where was the slope of the Theil–Sen regression line, and was the trial number in the experiment. The guarding reflex was adjusted using the same equation but for the .
3.2 |. The micturition reflex occurred at a constant volume, and the guarding reflex occurred at a constant pressure
The mean was approximately constant across infusion rates, whereas increased with infusion rate. In a typical experiment (Figure 3), increased as the infusion rate increased, whereas, despite large intertrial variability, mean was similar across infusion rates. These patterns translated to across animal comparisons where infusion rate did not have a significant effect on the (wANOVA, F = 0.74, p = 0.72, Figure 4A), but did have a significant effect on (wANOVA F = 2.57, p < 0.01, Figure 4B). The fact that the was invariant to infusion rate suggests that the micturition reflex is triggered when bladder volume exceeds a critical threshold.
FIGURE 3.

The effect of infusion rate on volume and pressure at time of the micturition reflex () for a single animal. (a) The time-adjusted volumes at the micturition reflex onset were similar across different infusion rates. For this animal, the increased by 12% across infusion rates. (b) The pressure at the micturition reflex onset is dependent on the infusion rate, with higher infusion rates eliciting higher pressures. Here the relative change in across infusion rates was 105%. This animal was exposed to the infusion rates from group 4 (Table 1). The open circles represent a data point from a single trial, closed circles represent the mean, and the error bars are the standard deviation.
FIGURE 4.

The effect of infusion rate on volume and pressure at the onset of lower urinary tract reflexes. The volume data are adjusted for the trial effect, which was done before the normalization described in the Methods. (a) The volume at the micturition reflex did not have a significant effect of infusion rate and was almost constant across infusion rates. (b) The pressure at the micturition reflex increased with infusion rate. (c) The volume at the guarding reflex decreased with infusion rate, but the relationship was not significant (F = 1.5114, p = 0.1755). (d) The pressure at the guarding reflex has no relationship with the infusion rate. Taken together, the micturition reflex appears to be triggered at a fixed volume, whereas the guarding reflex is triggered at a fixed pressure. Relative infusion rates (see Table 1) were concentrated around similar values, and so were grouped together at 4.5, 6, 8, or 10 mL/h in the summary plots. Each point on the graph represents the average volume or pressure at reflex onset. For (a and b) from left to right, the number of animals per point is 13, 11, 12, 16, 11, 16, 23, 16, 25, 11, 25, 14, 13, 16, and 12 corresponding to infusion rates of 0.92, 1.3, 2.4, 3.93, 4.5, 5, 6, 6.86, 8, 10, 10.8, 16.2, 21.6, 32.7, and 65.5 mL/h. For (c and d) from left to right, the number of animals per point is 4, 4, 4, 7, 5, 7, 10, 7, 11, 5, 11, 7, 7, 8, 6, corresponding to infusion rates of 0.92, 1.3, 2.4, 3.93, 4.5, 5, 6, 6.86, 8, 10, 10.8, 16.2, 21.6, 32.7, and 65.5 mL/h. The achieved power for an ω2 = 0.5 is 0.046. Data expressed as mean ± standard deviation.
was approximately constant across infusion rates, and decreased as a function of infusion rate (Figure 4C,D). The effect of infusion rate was not significant for (wANOVA, F = 0.84, p = 0.61) or (rANOVA, F = 1.51, p = 0.17). It appears infusion rate decreases despite no statistical effect. The constant suggests that there may be a pressure threshold that activates the guarding reflex. However, different from the micturition reflex, the guarding reflex was not activated in every trial (guarding occurred in 82% of trials included in the guarding analysis). Additionally, the guarding reflex was activated during either the early or late stages of filling which may correspond to different levels of afferent activation. Because the guarding reflex was not always activated and that it was activated at different levels of afferent activation suggest that there are additional circumstances necessary for the activation of the guarding reflex beyond passing a pressure threshold.
The effect of infusion rate was assessed on other cystometric parameters (Figure 5). Infusion rate had a significant effect on contraction duration (wANOVA, F = 4.272, p < 0.001), and filling duration (wANOVA, F = 48.79, p < 0.001), but no effect on contraction pressure (rANOVA, F = 2.15, p = 0.06), compliance (wANOVA, F = 1.25, p = 0.25), contraction amplitude (rANOVA, F = 0.85 p = 0.61), or voiding efficiency (rANOVA, F = 1.28, p = 0.51). Data values are presented in Table 2.
FIGURE 5.

The effect of infusion rate on various cystometry parameters. (a) Contraction pressure is the pressure just before the high-frequency pressure fluctuations marking the start of a void. The normalized contraction pressure had a nearly significant increasing relationship with infusion rate. (b) Compliance was defined as the sum of the volume infused from the pump and the ureters divided by the pressure at the micturition reflex . Compliance in general decreased with infusion rate, though the effect was not significant. Compliance was cube-root transformed for statistical analysis. (c) Contraction amplitude is the difference in contraction pressure from . The normalized contraction amplitude remained approximately constant until higher infusion rates. (d) Contraction duration is the time between micturition reflex onset and the time of the second pressure peak at the end of the void. Contraction duration significantly decreased with infusion rate . (e) Voiding efficiency was defined as the ratio of voided volume to the sum of voided volume and residual volume . Voiding efficiency was approximately constant across infusion rates. (f) The filling duration is the difference in time from the contraction pressure to the pump turning on. Filling duration had a strong log–log relationship with infusion rate . From left to right, the number of animals per point is 13, 11, 12, 16, 11, 16, 23, 16, 25, 11, 25, 14, 13, 16, and 12 corresponding to infusion rates of 0.92, 1.3, 2.4, 3.93, 4.5, 5, 6, 6.86, 8, 10, 10.8, 16.2, 21.6, 32.7, and 65.5 mL/h. Data expressed as mean ± standard deviation.
TABLE 2.
The effect of infusion rate on reflex and voiding variables.
| Q (mL/h) | n | PGR | VGR | PMR | VMR | Contract pressure | Compliance (mL/mm Hg) | Contraction amplitude | Contract duration (s) | Voiding efficiency (%) | Filling duration (s) |
|---|---|---|---|---|---|---|---|---|---|---|---|
| 0.92 | 13/4 | 0.96 ± 0.26 | 1.52 ± 0.47 | 0.83 ± 0.18 | 1 ± 0.09 | 0.94 ± 0.18 | 0.066 ± 0.046 | 1.08 ± 0.29 | 11.3 ± 2.5 | 92.4 ± 8 | 755.1 ± 486.3 |
| 1.3 | 11/4 | 0.96 ± 0.22 | 1.31 ± 0.26 | 0.83 ± 0.17 | 1 ± 0.1 | 0.83 ± 0.17 | 0.051 ± 0.022 | 0.94 ± 0.16 | 12.2 ± 4.6 | 89.4 ± 10.5 | 576.9 ± 377.1 |
| 2.4 | 12/4 | 1.21 ± 0.62 | 1.07 ± 0.16 | 0.96 ± 0.11 | 1.01 ± 0.09 | 1.02 ± 0.1 | 0.05 ± 0.02 | 1.02 ± 0.17 | 12 ± 1.9 | 88.4 ± 12.9 | 439.5 ± 191 |
| 3.93 | 16/7 | 1.07 ± 0.33 | 1.05 ± 0.26 | 0.98 ± 0.13 | 1.01 ± 0.13 | 0.99 ± 0.09 | 0.046 ± 0.018 | 0.99 ± 0.15 | 10.8 ± 3.2 | 86.7 ± 14.6 | 298.7 ± 151.9 |
| 4.5 | 11/5 | 1.01 ± 0.17 | 0.94 ± 0.18 | 0.98 ± 0.18 | 0.98 ± 0.1 | 0.96 ± 0.11 | 0.059 ± 0.074 | 0.97 ± 0.14 | 8.1 ± 1.9 | 91.6 ± 5.5 | 192.4 ± 125.9 |
| 5 | 16/7 | 1.24 ± 0.29 | 1.06 ± 0.12 | 0.99 ± 0.15 | 1.02 ± 0.07 | 0.99 ± 0.1 | 0.045 ± 0.016 | 0.99 ± 0.13 | 12.4 ± 5 | 88.3 ± 12.2 | 233.5 ± 107.8 |
| 6 | 23/10 | 1.13 ± 0.36 | 1.19 ± 0.44 | 0.96 ± 0.14 | 1.01 ± 0.08 | 0.94 ± 0.11 | 0.046 ± 0.025 | 0.97 ± 0.15 | 9.9 ± 2.1 | 88.6 ± 12.1 | 159.8 ± 71 |
| 6.86 | 16/7 | 1.27 ± 0.34 | 1.02 ± 0.15 | 0.96 ± 0.13 | 0.98 ± 0.09 | 0.98 ± 0.1 | 0.05 ± 0.036 | 0.99 ± 0.16 | 11.2 ± 3.4 | 89.3 ± 12.7 | 158 ± 77.9 |
| 8 | 25/11 | 1.22 ± 0.46 | 1.16 ± 0.32 | 1.02 ± 0.19 | 1 ± 0.13 | 0.97 ± 0.14 | 0.039 ± 0.017 | 0.94 ± 0.18 | 9.6 ± 2.5 | 89 ± 13.4 | 131.6 ± 66.4 |
| 10 | 11/5 | 1.05 ± 0.47 | 1.16 ± 0.25 | 0.95 ± 0.18 | 0.97 ± 0.14 | 0.9 ± 0.15 | 0.037 ± 0.021 | 0.95 ± 0.19 | 9.2 ± 1.8 | 84.3 ± 12.4 | 106 ± 56.9 |
| 10.8 | 25/11 | 1 ± 0 | 1 ± 0 | 1 ± 0 | 1 ± 0 | 1 ± 0 | 0.043 ± 0.024 | 1 ± 0 | 10 ± 2.9 | 87.4 ± 13.7 | 103.4 ± 63.8 |
| 16.2 | 14/7 | 0.94 ± 0.3 | 1.08 ± 0.27 | 1.11 ± 0.2 | 1.03 ± 0.12 | 1.02 ± 0.17 | 0.036 ± 0.019 | 0.97 ± 0.09 | 8.5 ± 1.3 | 90 ± 12.8 | 75.2 ± 39.5 |
| 21.6 | 13/7 | 0.99 ± 0.37 | 0.98 ± 0.18 | 1.1 ± 0.17 | 0.99 ± 0.09 | 1.05 ± 0.22 | 0.037 ± 0.02 | 0.97 ± 0.18 | 9 ± 3 | 86.1 ± 21.4 | 51.7 ± 31.1 |
| 32.7 | 16/8 | 0.92 ± 0.39 | 0.87 ± 0.18 | 1.16 ± 0.3 | 1.03 ± 0.15 | 1.1 ± 0.19 | 0.033 ± 0.016 | 1.05 ± 0.2 | 8.5 ± 2 | 91.9 ± 11.9 | 36.1 ± 15.8 |
| 65.5 | 12/6 | 1.21 ± 0.58 | 0.74 ± 0.13 | 1.13 ± 0.31 | 0.99 ± 0.14 | 1.21 ± 0.35 | 0.033 ± 0.02 | 1.24 ± 0.4 | 7.5 ± 1.6 | 95 ± 4.6 | 18.6 ± 10.3 |
Note: PGR and PMR, contraction pressure, contraction amplitude, and VGR and VMR are normalized as described in Equation 2 and are, therefore, unitless. Contraction pressure is the maximum pressure before the void. Compliance is the difference in volume between the pump tuming on the micturition reflex onset divided by the PMR. Contraction duration is the time between the time of the micturition reflex and the second pressure peak ffom the bladder pressure time series which signifies the closing of the sphincter. Voiding efficiency is the volume voided divided by the sum of the volume voided and the residual volume. Filling duration is the time from the start of infusion pump to the time of the micturition reflex. Relative rates were concentrated around similar values and so were grouped together at 4.5, 6, 8, or 10 mL/h. Experiment n is reported as two numbers, the first number represents the number of animals used for the analysis of micturition reflex and other cystometric variables, and the second number was the number of animals included in the guarding reflex analysis. Data are presented as mean and standard deviations.
Abbreviations: PGR, pressure at the onset of the guarding; PMR, pressure at the onset of the micturition reflexes; VGR, volume at the onset of the guarding; VMR, volume at the onset of the micturition reflexes.
4 |. DISCUSSION
We explored how bladder infusion rate influences when the micturition (bladder-contracting) and guarding (EUS-contracting) reflexes engage during the filling cycle, under anesthesia. If the micturition reflex is activated by bladder tension, a common assertion,7,8 we expect to see reflex activation at a constant bladder pressure, since it is directly proportional to tension (see Equation 1). Instead, what we found (from infusion rates spanning two orders of magnitude) was that the micturition reflex activates at a constant bladder volume regardless of the attendant intravesical pressure (Figure 4A,B). Perhaps the simplest explanation is that the micturition reflex is organized as a volume detector with a fixed activation threshold. Interestingly, the guarding reflex did not activate at a consistent bladder volume, suggesting that its organization is not a simple volume threshold (Figure 4C,D). We also noted a gradual and significant increase in BC throughout the duration of each experiment (Figure 2).
The effect of infusion rate was predominantly evident on variables of pressure and time. The observed effect of infusion rate on pressure was similar to what was reported in cats.19 Klevmark observed that when using natural infusion rates, bladder pressure did not change for the duration of the fill.19 At natural infusion rates in the present study, the pressure at tended to be lower than at infusion rates in the cystometric and extreme ranges. Filling duration had a 1/× type relationship with infusion rate which was similar to what has been reported previously.20,21 Similarly, the contraction duration was significantly affected by infusion rate. Contraction duration was defined as the time from to the second pressure peak which represents the EUS closing against the contracting bladder. A shorter contraction duration would decrease voiding efficiency if the contraction duration was indicative of the fluid emission portion of the contraction (i.e., the difference in time between the two pressure peaks). However, the contraction duration includes the time between the pressure peaks (which was not different across infusion rates—data not shown) and the time from to the time of the contraction pressure. Since the voiding efficiency and the time between pressure peaks did not change with infusion rate, the change in contraction duration would then reflect the difference in time between and the contraction pressure across infusion rates. At rates larger than 10.8 mL/h, the change in pressure with time during an individual CMG may alter the natural time course of the bladder contractions. At rates larger than 10.8 mL/h we observed (Figure 5A) larger contraction pressures and at rates larger than 21.6 mL/h larger contraction amplitudes (Figure 5C). Therefore, the decreased contraction duration may be an artifact related to the infusion rate altering the rate of pressure rise before the pressure peak.
4.1 |. Reflex activation
Although Laplace′s Law is typically expressed mathematically to compute bladder tension, causally it is the volume (infused by us or through the ureters) that deforms the bladder and leads to changes in pressure and tension, (Figure 6, solid arrows). That micturition occurred at a constant volume, despite changing flows and pressures (Figure 5A), suggests the nervous system has access to bladder volume without necessarily filtering through the bladder biomechanics that generate tension and pressure (see the arrow from “Bladder Volume” bypassing “Bladder Biomechanics” to influence “Bladder Afferents” in Figure 6). We also note that this access is conceptual, and that this work cannot differentiate between (i) the existence of an arrangement of global volume-sensing bladder afferents and (ii) the nervous system using local pressure or tension data to compute global volume.
FIGURE 6.
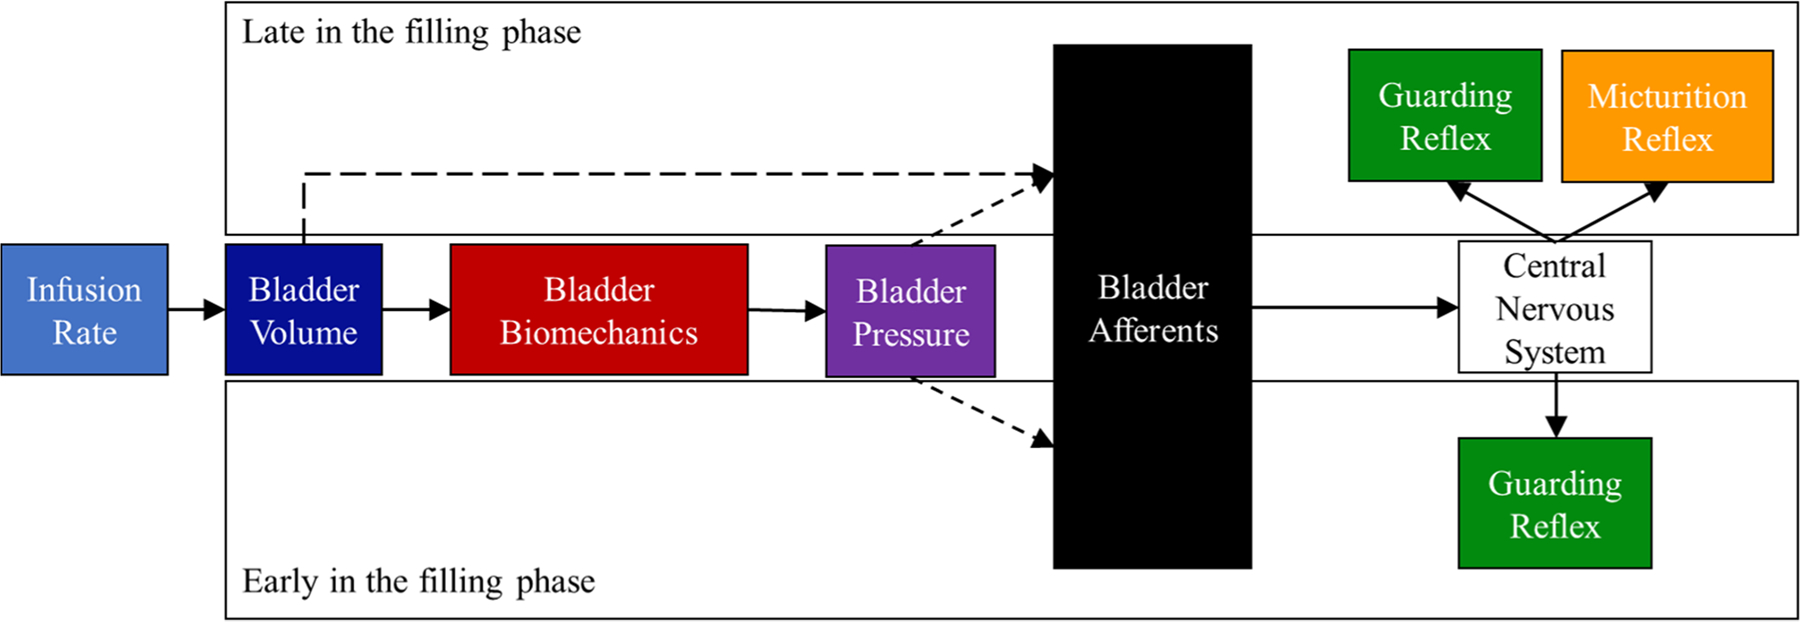
We found that the lower urinary tract reflexes were activated by different stimuli during the filling phase. The infusion rate controls the rate of volume inflow into the bladder. The change in the bladder volumes causes the bladder walls to expand which alters the intramural wall tension and intravesical pressure. Near the beginning of filling, pressure, volume, and afferent activity are low. The guarding reflex was activated at a constant pressure independent of bladder volume meaning that pressure may activate the guarding reflex early or late in the filling phase (the dashed arrow from “Bladder Volume” to “Bladder Afferents”). Filling ends with the onset of the micturition reflex which was dependent on volume. Dashed lines represent our hypothesis of when (in the filling phase) the state variables in the bladder contribute to the afferent activity. In the figure, we do not “turn off” the guarding reflex because this action is controlled by a coordinated command from the central nervous system rather than an action mediated through afferent sensation.4
In either case, a simple volume threshold to trigger the micturition reflex is unlikely to be the complete explanation. There is substantial variability in the volume at micturition both within (Figure 2A) and between (Figure 4A) animals, raising the question of what processes account for these differences. There is also a slow creep in BC throughout the experiment (Figure 2D) influencing this volume (see next section). Moreover, complex time-varying patterns of afferent activation appear critical for regulating proper reflex control.9,10,16 There may also be isovolumetric perturbations, like postural shifts, that would impact bladder afferent discharge and that we can reasonably expect to influence reflex thresholds. But unresolved details notwithstanding, the conspicuous infusion rate independence suggests the nervous system incorporates bladder volume into a determination of when to trigger the micturition reflex.
Because the bladder afferents are converging on volume to activate the reflex bladder contraction, the CNS is likely interpreting afferent activity that is correlated with volume. It has been postulated that there are populations of afferents that are specifically encoded for volume22,23; however, these afferents are often classified as chemoreceptors which implies that under normal physiological conditions, they may not be active.24 Alternatively, activity from stretch-sensitive afferents may exhibit activation patterns that correlate with intravesical volume.10 The urothelium, for instance, releases signaling molecules in response to increased bladder fluid volume,25 which can excite local afferents.26 The urothelium has been described as a “sensory web” that coordinates the activity of the underlying muscle and afferents.27 Such control may imply that the urothelium acts as a global volume sensor which leverages input from intravesical volume into increased afferent outflow.
The finding of a constant PGR implies that the CNS has access to pressure. Unlike the micturition reflex, the guarding reflex was not activated in every trial during the filling phase, similar to observations made by others.6,17 We observed the tonic activation guarding reflex during filling in 48% of rats. Of the animals with observable guarding during filling, 18% of the trials did not have guarding during filling, which implies that there may be additional circumstances affecting activation. Additionally, the guarding reflex was activated early in filling when afferent activation is low, and late in filling when afferent activation is high, irrespective of relative bladder volume (see arrows from “Bladder Pressure” influencing “Bladder Afferents” at “Early” and “Late” during the filling phase in Figure 6). The circuitry for the guarding reflex is thought to reside in the spinal cord which allows for quick control of the EUS in case of sudden increases in abdominal pressure.4 A volume sensor may be poorly calibrated to sense isovolumetric strain as a result of sudden increases in abdominal pressure or shifting posture. Therefore, pressure sensitivity may enable tighter reflex control of continence.
4.2 |. Observed time dependence
We observed that in repeated fill-to-void cycles BC increased over time, which has previously been reported in urethane-anesthetized rats.28,29 The increase in BC observed by Peng et al. occurred over a shorter time (~1 h) and was attributed to an increase in infusion rate.28 As compared to the current study, Peng et al. increased infusion rate in ascending order, and infusion rates were introduced during continuous cystometry every 3rd–4th void of a 10–12 void series. Peng et al. concluded that the increase in BC was due to an increased infusion rate, however, the present results challenge this conclusion. Pseudo-random presentation of infusion rates increased BC, which signifies that it was repeated cycles of filling and voiding that was causing the change in BC rather than an increase in infusion rate alone. Importantly, the sequential ordering of infusion rates did not result in an increased BC in an in vitro whole bladder preparation,30 suggesting that the CNS has a role in the observed increase in BC. The time effect observed in the present study may have resulted from reduced anesthetic depth of urethane, a biomechanical alteration that reduced bladder wall tension, or local neural adaptation to repeated stimuli that reduced CNS sensitivity to bladder wall tension (see Figure 7).
FIGURE 7.
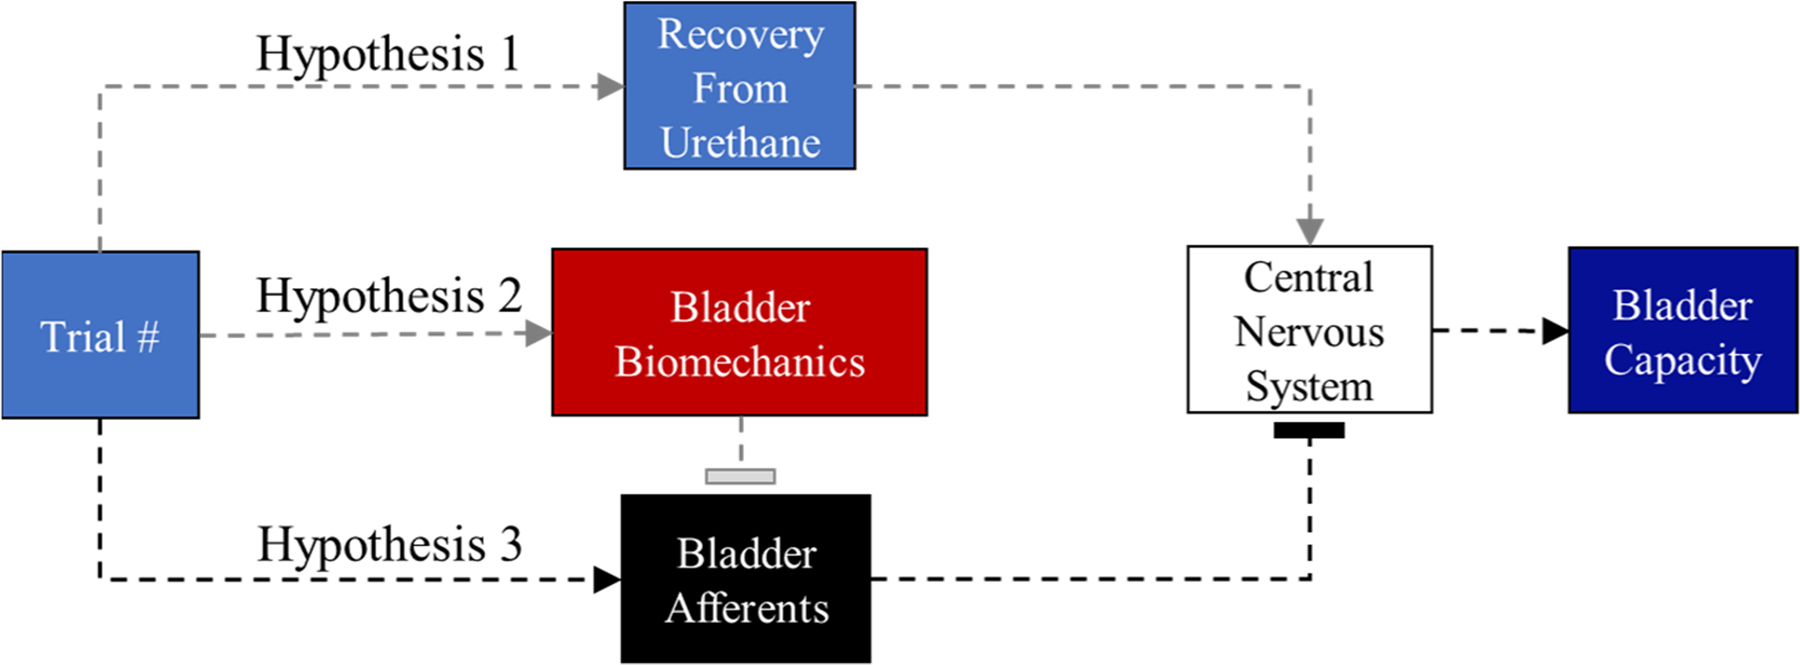
Proposed mechanism for the time effect on bladder capacity. Hypothesis 1: As the experiment progresses, the central nervous system is slowly recovering from the urethane anesthesia. Urethane has been shown to reduce bladder capacity in rats. It is believed that the gradual recovery from urethane anesthesia reduces the descending inhibition from the supraspinal centers. Hypothesis 2: Repeated filling and voiding cycles cause biomechanical deformation which over time alters compliance in the urinary bladder. Increased compliance leads to more accommodation of volume. It may be tempting to associate a change in function (increased filling capacity) with muscle fatigue, however, a reduction in muscular strength due to fatigue would have little effect on the ability of the bladder to sense changes in volume or pressure. Hypothesis 3: Repeated filling and voiding cycles interferes with the normal recovery of afferent neurons such that repeated stimulus results in lower activation levels. Flat arrow heads mean that the previous box is reducing input. We show Hypothesis 3 in black because this seems the most plausible.
Urethane may have a time-dependent alteration on the micturition reflex that is independent of its analgesic effects.29 Urethane alters the normal function of micturition by reducing BC,31 through glutamatergic depression of descending inhibition from supraspinal centers.32 Yokoyama and colleagues observed a 25% increase in BC over 6 h in urethane-anesthetized rats when a CMG was performed every hour. The increase in BC reported by Yokoyama et al. was observed using a single infusion rate with hour-long rest periods between CMG, suggesting that the depressive effects of urethane on the micturition reflex may decay over long experiment durations.29 The depressive effect of urethane may have only partially contributed to the observed increase in BC, as awake and sham-operated (exposed carotid artery) awake controls exhibited a 10% increase and no increase, respectively in BC over 6 h.29 It seems possible that the depressive effect of urethane on the micturition reflex changes over long experiment durations, but the effect observed in the current study was much larger, which points to an additional mechanism.
The second hypothesis is that changes in BC are due to changes in bladder wall biomechanics caused by repeated filling and voiding cycles. Repeated activation of bladder muscle strips altered the length-tension relationship of both active (activated contractile elements) and passive (viscoelastic elements) tensions.33–35 It is possible that the length-tension relationship was shifting in the current experiment which allowed for an accommodation of more fluid volume while maintaining voiding efficiency. Alternatively, it is possible that the bladder underwent plastic deformation which allows for the bladder to stretch to higher volumes at lower relative tension.36 Plastic deformation can also be reversed by muscle contraction33; however, sufficiently large distensions or fast distension rates (i.e., high infusion rates) may injure the bladder wall irreparably. If the imposed infusion rates were causing irreparable damage, then we would expect that voiding efficiency would decrease with time, which was not the case. Additionally, the amount of accommodation (change in BC with time) was similar between animals that were subjected to the highest infusion rates, to those that only experienced rates that produced physiological tensions.12,15
The third hypothesis is that neural adaptation is the mechanism for the increased BC with trial. For example, urethral afferent responses are reduced after a repeated mechanical urethral stimulus, an effect that does not appear to have a biomechanical mechanism and which lasts up to 15 min.16 A similar neural accommodation could be present in the pelvic afferents. Neurostimulation of the sensory pudendal nerve have resulted in increased BC during poststimulation periods.37 Hokanson and colleagues37 reported that stimulation of the sensory pudendal nerve increased BC in an overactive bladder model in the rat with carry-over effects lasting longer than 40 min.37 Baseline BC was never recovered, which resulted in an iterative increase in BC with repeated exposure to a neurostimulation protocol. The longer recovery from neural activations supports the hypothesis that the time effect was due to a neural mechanism. We hypothesize that the time effect was neurally mediated, but more research is necessary to confirm.
4.3 |. Limitations and translation
This study has several limitations when considering translation to human urodynamics. First, bladders experienced supraphysiological tensions by the imposed infusion rates which will never occur from natural filling. The use of extreme infusion rates was for the specific purpose of defining how across physiological and supraphysiological distension rates, the CNS tracks pressure and volume. The use of supraphysiological infusion rates alters the normal biomechanics of filling and changes the pressure profile from a quasi-static pressure during natural filling to a gradual increase in pressure with the addition of infused fluid.19 We observed that increasing infusion rate had a significant effect on the pressure to evoke the micturition reflex, which was similar to Andersson and colleague′s observation in humans, where for the majority of filling a higher infusion rate resulted in higher filling pressures.38 Consequently, infusion rate has been termed a confound in urodynamics,39 such that noninvasive techniques are being developed to circumvent the need for infusing volume into the bladder for urodynamic research.40
An interesting observation in urodynamics is that the consecutive fills from a catheter have often been reported to have an accommodating effect on bladder sensation (i.e., increased volume at first desire in repeated fillings) in healthy41,42 and symptomatic individuals.43,44 The observed delay in bladder sensation was thought to represent a global neural adaptation to repeated filling which could plausibly fit into the neural hypothesis as proposed in Figure 7.40,41 Importantly, delayed sensation was also observed in a noninvasive volume loading protocol where the second natural fill (through diuresis) exhibited delayed first sensation and had a larger BC as compared to the first fill.40 Though the noninvasive protocol may delay bladder sensation through a different mechanism (i.e., global fluid balance), the mechanism of delayed sensation observed in cystometry may provide relevant insight into the local adaptations the LUT makes in response to increased bladder activity.
The trial effect on pressure was nearly significant (p = 0.053) and represented a physiologically small change in pressure over the experiment. It is possible that more animals may have shifted the hypothesis test toward a significant result, however, the trial effect on pressure may not be biologically relevant. Moreover, because of the relationship between tension, volume, and pressure as described by Laplace′s Law we would expect that for a large change in volume the corresponding change in pressure would be small; combined with the variability observed in Figure 2I, the effect may be obscured. Regardless the relative difference between a 10% increase in pressure has much less of an impact (<1 mmHg) than the 105% increase in volume.
We used the conservation of volume described earlier ( or the sum of the and is equal to the volume infused and the volume infused by the ureters )18 as inclusion criteria in our analysis. We excluded 18% of trials because the estimated ureter infusion rate fell outside of physiologically feasible fill rates (0–2 mL/h), thus indicating the combination of measurements for a trial were inaccurate. Evaluating the accuracy of measurements is rare in rodent-cystometry literature, so it is difficult to determine if the fraction we reported as violating the conservation of volume is large relative to what is typical. To help contextualize our results, we constructed a simulation of a basic cystometry study (see Supplemental Materials) to observe if the proportion of trials we rejected was similar to what would be expected under typical conditions. We based the parameters on the error associated with the measurements of the , and the infusion rate. The probability of rejecting the simulated data at each infusion rate was similar to what was observed in the experiment (Figure S1B); therefore, there is a limit to reliability based on the precision of the current gold-standard cystometry techniques.
5 |. CONCLUSION
We found that the LUT, despite responding primarily to tension-sensitive mechanoreceptors, activated the micturition reflex at a constant volume and the guarding reflex at similar pressures across a broad range of infusion rates. This result requires that a mechanism for which volume can be interpreted by the CNS is described. The observed trial effect raised significant questions about how the LUT responds to continual perturbation.
Supplementary Material
ACKNOWLEDGMENTS
We would like to acknowledge Maria Gomes Vallilo for her assistance in running the experiments. Research was funded by OT2OD030524 and R01DK133605.
Funding information
Common Fund; National Institute of Diabetes and Digestive and Kidney Diseases; OT2OD030524; R01DK133605
Footnotes
CONFLICT OF INTEREST STATEMENT
The authors declare no conflict of interest.
ETHICS STATEMENT
Protocols and methods were approved by the Institutional Animal Care and Use Committee of Florida International University. Protocol number 20–050-AM02.
SUPPORTING INFORMATION
Additional supporting information can be found online in the Supporting Information section at the end of this article.
DATA AVAILABILITY STATEMENT
Data will be published at https://sparc.science/.
REFERENCES
- 1.Bradley WE, Teague CT. Electrophysiology of pelvic and pudendal nerves in the cat. Exp Neurol. 1972;35(2):378–393. doi: 10.1016/0014-4886(72)90162-8 [DOI] [PubMed] [Google Scholar]
- 2.Danziger ZC, Grill WM. Sensory feedback from the urethra evokes state-dependent lower urinary tract reflexes in rat. J Physiol. 2017;595(16):5687–5698. doi: 10.1113/JP274191 [DOI] [PMC free article] [PubMed] [Google Scholar]
- 3.Barrington FJF. The nervous mechanism of micturition. Q J Exp Physiol. 1914;8(1):33–71. [Google Scholar]
- 4.Fowler CJ, Griffiths D, De Groat WC. The neural control of micturition. Nat Rev Neurosci. 2008;9(6):453–466. doi: 10.1038/nrn2401 [DOI] [PMC free article] [PubMed] [Google Scholar]
- 5.Maggi CA, Meli A. Suitability of urethane anesthesia for physiopharmacological investigations. Part 3: other systems and conclusions. Experientia. 1986;42(5):531–537. http://www.ncbi.nlm.nih.gov/pubmed/3519271 [DOI] [PubMed] [Google Scholar]
- 6.Stone E, Coote JH, Allard J, Lovick TA. GABAergic control of micturition within the periaqueductal grey matter of the male rat. J Physiol. 2011;589(8):2065–2078. doi: 10.1113/jphysiol.2010.202614 [DOI] [PMC free article] [PubMed] [Google Scholar]
- 7.Le Feber J, Van Asselt E, Van Mastrigt R. Afferent bladder nerve activity in the rat: a mechanism for starting and stopping voiding contractions. Urol Res. 2004;32(6):395–405. doi: 10.1007/s00240-004-0416-8 [DOI] [PubMed] [Google Scholar]
- 8.Satchell P, Vaughan C. Bladder wall tension and mechanoreceptor discharge. Pflugers Arch. 1994;426(3–4):304–309. doi: 10.1007/BF00374786 [DOI] [PubMed] [Google Scholar]
- 9.Iijima K, Igawa Y, Wyndaele JJ. Mechanosensitive primary bladder afferent activity in rats with and without spinal cord transection. J Urol. 2009;182(5):2504–2510. doi: 10.1016/j.juro.2009.07.012 [DOI] [PubMed] [Google Scholar]
- 10.Heppner TJ, Tykocki NR, Hill-Eubanks D, Nelson MT. Transient contractions of urinary bladder smooth muscle are drivers of afferent nerve activity during filling. J Gen Physiol. 2016;147(4):323–335. doi: 10.1085/jgp.201511550 [DOI] [PMC free article] [PubMed] [Google Scholar]
- 11.Drake MJ, Harvey IJ, Gillespie JI. Autonomous activity in the isolated Guinea pig bladder. Exp Physiol. 2003;88(1):19–30. doi: 10.1113/eph8802473 [DOI] [PubMed] [Google Scholar]
- 12.Fraser MO, Smith PP, Sullivan MP, et al. Best practices for cystometric evaluation of lower urinary tract function in muriform rodents. Neurourol Urodyn. 2020;39(6):1868–1884. doi: 10.1002/nau.24415.Best [DOI] [PMC free article] [PubMed] [Google Scholar]
- 13.Angoli D, Geramipour A, Danziger ZC. Validation of an efficient and continuous urodynamic monitoring system for awake, unrestrained, chronic rodent studies. Am J Physiol Renal Physiol. 2020;318(1):F86–F95. doi: 10.1152/ajprenal.00349.2019 [DOI] [PubMed] [Google Scholar]
- 14.Lee KM, Reed LL, Bove DL, Dill JA. Effects of water dilution, housing, and food on rat urine collected from the metabolism cage. Lab Anim Sci. 1998;48(5):520–525. [PubMed] [Google Scholar]
- 15.Andersson K-E, Soler R, Füllhase C. Rodent models for urodynamic investigation. Neurourol Urodyn. 2011;30:636–646. [DOI] [PubMed] [Google Scholar]
- 16.Danziger ZC, Grill WM. Dynamics of the sensory response to urethral flow over multiple time scales in rat. J Physiol. 2015;593:3351–3371. [DOI] [PMC free article] [PubMed] [Google Scholar]
- 17.D′Amico SC, Schuster IP, Collins WF. Quantification of external urethral sphincter and bladder activity during micturition in the intact and spinally transected adult rat. Exp Neurol. 2011;228(1):59–68. doi: 10.1016/j.expneurol.2010.12.008 [DOI] [PubMed] [Google Scholar]
- 18.Danziger ZC, Grill WM. Estimating postvoid residual volume without measuring residual bladder volume during serial cystometrograms. Am J Physiol Renal Physiol. 2016;311(2): F459–F468. doi: 10.1152/ajprenal.00516.2015 [DOI] [PMC free article] [PubMed] [Google Scholar]
- 19.Klevmark B Motility of the urinary bladder in cats during filling at physiological rates I. Intravesical pressure patterns studied by a new methods of cystometry. Acta Physiol Scand. 1974;90:565–577. doi: 10.3109/00365598009179565 [DOI] [PubMed] [Google Scholar]
- 20.Kim AK, Hill WG. Effect of filling rate on cystometric parameters in young and middle aged mice. Bl (San Fr. 2017;4(1):1–11. doi: 10.14440/bladder.2017.88.Effect [DOI] [PMC free article] [PubMed] [Google Scholar]
- 21.Maggi CA, Santicioli P, Giuliani S, Furio M, Meli A. The capsaicin-sensitive innervation of the rat urinary bladder: further studies on mechanisms regulating micturition threshold. J Urol. 1986;136(3):696–700. doi: 10.1016/S0022-5347(17)45030-0 [DOI] [PubMed] [Google Scholar]
- 22.Morrison J. The activation of bladder wall afferent nerves. Exp Physiol. 1999;84(1):131–136. doi: 10.1111/j.1469-445x.1999.tb00078.x [DOI] [PubMed] [Google Scholar]
- 23.Shea VK, Cai R, Crepps B, Mason JL, Perl ER. Sensory fibers of the pelvic nerve innervating the rat′s urinary bladder. J Neurophysiol. 2000;84(4):1924–1933. doi: 10.1152/jn.2000.84.4.1924 [DOI] [PubMed] [Google Scholar]
- 24.Moss NG, Harrington WW, Tucker MS. Pressure, volume, and chemosensitivity in afferent innervation of urinary bladder in rats. Am J Physiol. 1997;272(41):R695–R703. [DOI] [PubMed] [Google Scholar]
- 25.Wang ECY, Lee JM, Ruiz WG, et al. ATP and purinergic receptor-dependent membrane traffic in bladder umbrella cells. J Clin Invest. 2005;115(9):2412–2422. doi: 10.1172/JCI24086 [DOI] [PMC free article] [PubMed] [Google Scholar]
- 26.Merrill L, Gonzalez EJ, Girard BM, Vizzard MA. Receptors, channels, and signalling in the urothelial sensory system in the bladder. Nat Rev Urol. 2016;13(4):193–204. doi: 10.1038/nrurol.2016.13.Receptors [DOI] [PMC free article] [PubMed] [Google Scholar]
- 27.Apodaca G, Balestreire E, Birder LA. The uroepithelial-associated sensory web. Kidney Int. 2007;72(9):1057–1064. doi: 10.1038/sj.ki.5002439 [DOI] [PubMed] [Google Scholar]
- 28.Peng HY, Lai CY, Hsieh MC, Ho YC, Lin TB. Pressure-volume analysis of rat′s micturition cycles in vivo. Neurourol Urodyn. 2020;39(5):1304–1312. doi: 10.1002/nau.24363 [DOI] [PMC free article] [PubMed] [Google Scholar]
- 29.Yokoyama O, Yoshiyama M, Namiki M, de Groat WC. Influence of anesthesia on bladder hyperactivity induced by middle cerebral aretery occlusion in the rat. Am J Physiol. 1997;273(6):R1900–R1907. [DOI] [PubMed] [Google Scholar]
- 30.Heppner TJ, Hennig GW, Nelson MT, Herrera GM. Afferent nerve activity in a mouse model increases with faster bladder filling rates in vitro, but voiding behavior remains unaltered in vivo. Am J Physiol Regul Integr Comp Physiol. 2022;323(5): R682–R693. doi: 10.1152/ajpregu.00156.2022 [DOI] [PMC free article] [PubMed] [Google Scholar]
- 31.Matsuura S, Downie JW. Effect of anesthetics on reflex micturition in the chronic cannula- implanted rat. Neurourol Urodyn. 2000;19(1):87–99. doi: [DOI] [PubMed] [Google Scholar]
- 32.Yoshiyama M, Roppolo JR, De Groat WC. Alteration by urethane of glutamatergic control of micturition. Eur J Pharmacol. 1994;264(3):417–425. doi: 10.1016/0014-2999(94)00505-2 [DOI] [PubMed] [Google Scholar]
- 33.Speich JE, Borgsmiller L, Call C, Mohr R, Ratz PH. ROK-induced cross-link formation stiffens passive muscle: reversible strain-induced stress softening in rabbit detrusor. Am J Physiol Cell Physiol. 2005;289(1 58–1):C12–C21. doi: 10.1152/ajpcell.00418.2004 [DOI] [PubMed] [Google Scholar]
- 34.Almasri AM, Ratz PH, Speich JE. Length adaptation of the passive-to-active tension ratio in rabbit detrusor. Ann Biomed Eng. 2010;38(8):2594–2605. doi: 10.1007/s10439-010-0021-7 [DOI] [PubMed] [Google Scholar]
- 35.Speich JE, Almasri AM, Bhatia H, Klausner AP, Ratz PH. Adaptation of the length-active tension relationship in rabbit detrusor. Am J Physiol Renal Physiol. 2009;297(4): F1119–F1128. doi: 10.1152/ajprenal.00298.2009 [DOI] [PMC free article] [PubMed] [Google Scholar]
- 36.Neal CJ, Lin JB, Hurley T, et al. Slowly cycling rho kinase-dependent actomyosin cross-bridge “slippage” explains intrinsic high compliance of detrusor smooth muscle. Am J Physiol Renal Physiol. 2017;313(1):F126–F134. doi: 10.1152/ajprenal.00633.2016 [DOI] [PubMed] [Google Scholar]
- 37.Hokanson JA, Langdale CL, Sridhar A, Grill WM. Stimulation of the sensory pudendal nerve increases bladder capacity in the rat. Am J Physiol Renal Physiol. 2018;314(4):F543–F550. doi: 10.1152/ajprenal.00373.2017 [DOI] [PMC free article] [PubMed] [Google Scholar]
- 38.Andersson S, Bjerle P, Hentschel J, Kronström A, Niklasson U. Continuous and stepwise cystometry through suprapubic catheters—effect of infusion pattern and infusion rate on the cystometrogram of the normal human bladder. Clin Physiol. 1989;9:89–96. [DOI] [PubMed] [Google Scholar]
- 39.Lai HH, Naliboff B, Liu AB, et al. The LURN research network neuroimaging and sensory testing (NIST) study: design, protocols, and operations. Contemp Clin Trials. 2018;74: 76–87. doi: 10.1016/j.cct.2018.09.010 [DOI] [PMC free article] [PubMed] [Google Scholar]
- 40.Sheen D, Kolli H, Nagle AS, et al. Validation of a real-time bladder sensation meter during oral hydration in healthy adults: repeatability and effects of fill rate and ultrasound probe pressure. Low Urin Tract Symptoms. 2019;11(4):224–231. doi: 10.1111/luts.12275 [DOI] [PMC free article] [PubMed] [Google Scholar]
- 41.Brostrom S, Jennum P, Lose G. Short-term reproducibility of cystometry and pressure-flow micturition studies in healthy women. Neurourol Urodyn. 2002;21(5):457–460. doi: 10.1002/nau.10019 [DOI] [PubMed] [Google Scholar]
- 42.Gupta A, Defreitas G, Lemack GE. The reproducibility of urodynamic findings in healthy female volunteers: results of repeated studies in the same setting and after short-term follow-up. Neurourol Urodyn. 2004;23(4):311–316. doi: 10.1002/nau.20039 [DOI] [PubMed] [Google Scholar]
- 43.Jeon HJ, Choo MS, Oh SJ. The effect of posture and repetition on urodynamic parameters: a prospective randomized study. Investig Clin Urol. 2017;58(1):34–41. doi: 10.4111/icu.2017.58.1.34 [DOI] [PMC free article] [PubMed] [Google Scholar]
- 44.Sørensen SS, Nielsen JB, Nørgaard JP, Knudsen LM, Djurhuus JC. Changes in bladder volumes with repetition of water cystometry. Urol Res. 1984;12(4):205–208. doi: 10.1007/BF00256804 [DOI] [PubMed] [Google Scholar]
Associated Data
This section collects any data citations, data availability statements, or supplementary materials included in this article.
Supplementary Materials
Data Availability Statement
Data will be published at https://sparc.science/.