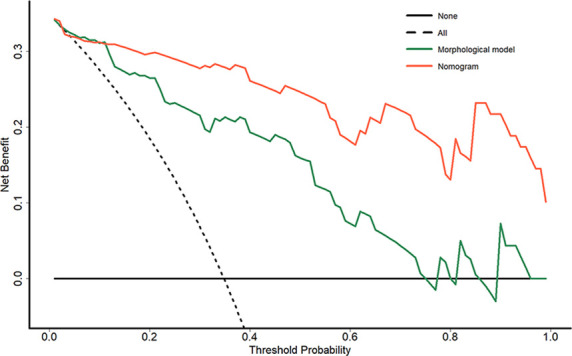
Figure 5.

Decision curve analysis for each model in the validation cohort: the y-axis measures the net benefit, which is calculated by summing the benefits (true-positive findings) and subtracting the harms (false-positive findings) and weighting the latter by a factor related to the relative harm of undetected MT-IP compared with the harm of unnecessary treatment; the decision curve showed that the application of nomogram to predict MT-IPs added more benefit than treating all or none of the patients or using the morphological model. MT-IP, inverted papilloma with malignant transformation.
