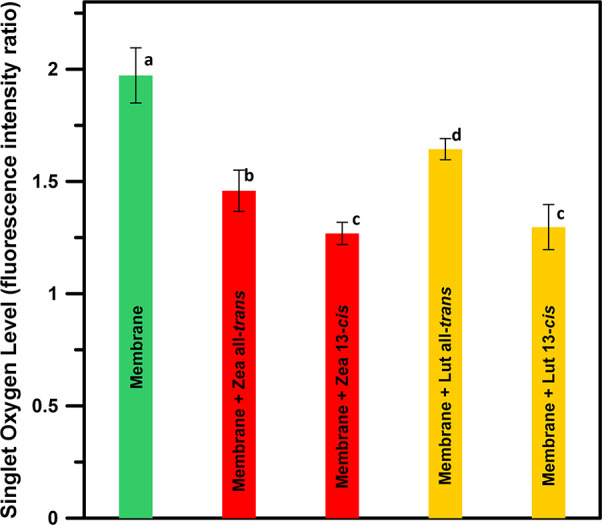
Figure 3.

Measure of singlet oxygen levels (proportional to the singlet oxygen concentration) in the system expressed as a total fluorescence signal of SOS (integrated number of emission photons in the SOS channel) in the images of a single liposome recorded with the pair of lasers (470 + 630 nm) divided by the total fluorescence signal of SOS recorded from the same liposome but excited with a single laser (470 nm) inducing fluorescence of the singlet-oxygen-sensitive probe but not absorbed by the TB photosensitizer. The data presented are arithmetic means from five to eight images from two independent preparations ± standard deviation (SD). Values followed by different letters are significantly different from each other (p < 0.05): (a) membrane, 1.97 ± 0.12; (b) membrane + all-trans zeaxanthin, 1.46 ± 0.09; (c) membrane + 13-cis zeaxanthin, 1.27 ± 0.05; (d) membrane + all-trans lutein, 1.64 ± 0.05; and (c) membrane + 13-cis lutein, 1.30 ± 0.10.
