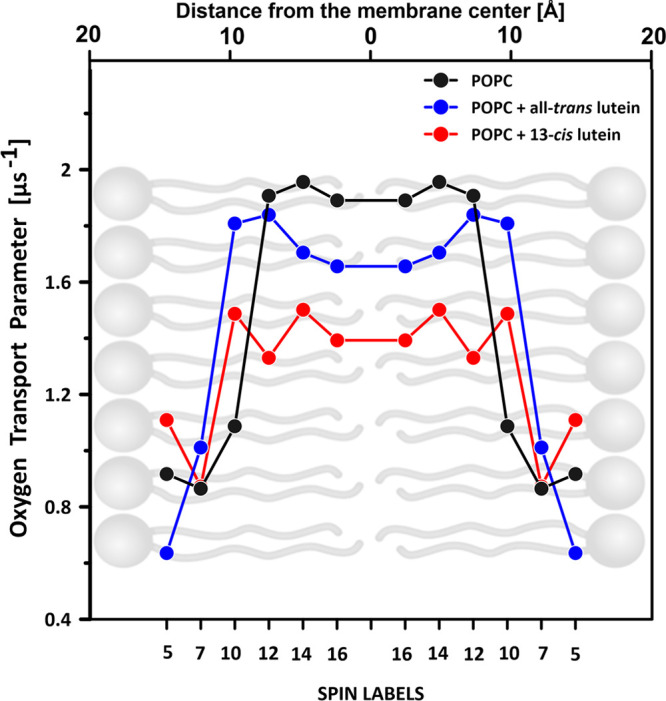
Figure 5.

Oxygen transport parameter profile across the lipid bilayer formed with pure POPC or POPC containing 1 mol % lutein in the molecular configuration all-trans or 13-cis. The values in the graph represent experiments performed with different n-PC spin labels (n is shown on the abscissa). The relationship is presented superimposed on a lipid bilayer model. Experimental points corresponding to different n-PC spin labels represent different experiments performed on separately prepared samples. Differences in the OTP in the central part of the hydrophobic core, determined on the basis of the 14-PC and 16-PC spin labels in each system, express the assay uncertainty. The estimation of the thickness of the POPC membrane, shown above the graph, is based on the molecular dynamics simulation.11
