Figure 4.
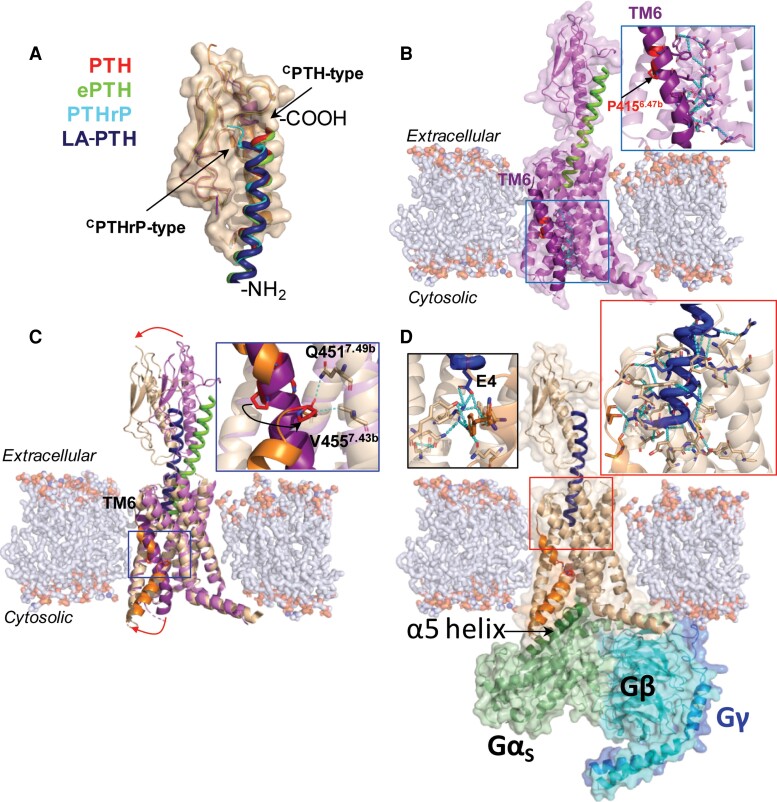
Structural characterization of PTH1R activation. (A) Overlaid structures of PTH1RECD in complex with distinct peptides, aligned by PTH1RECD. PTH, red coil (PDB 3C4M); PTHrP, cyan coil, (PDB 3H3G); ePTH, green coil (PDB 6FJ3); LA-PTH, dark blue coil (PDB 6NBF). The N- and C-termini of the peptides are denoted by -NH2 and -COOH, respectively. (B) Crystal structure of inactive state PTHR bound to ePTH (green coil, PDB 6FJ3). (C) Overlay of inactive (receptor in purple, ePTH in green, PDB 6FJ3) and fully activated (receptor in wheat, LA-PTH in dark blue, PDB 6NBF) PTH1R structures, aligned by their TMDs. TM6 is in deep purple or orange in inactive and fully active states, respectively. (D) Cryo-EM structure of fully activated LA-PTH-bound (dark blue coil) PTH1R (state 1) coupled to Gs heterotrimer (PDB 6NBF).

