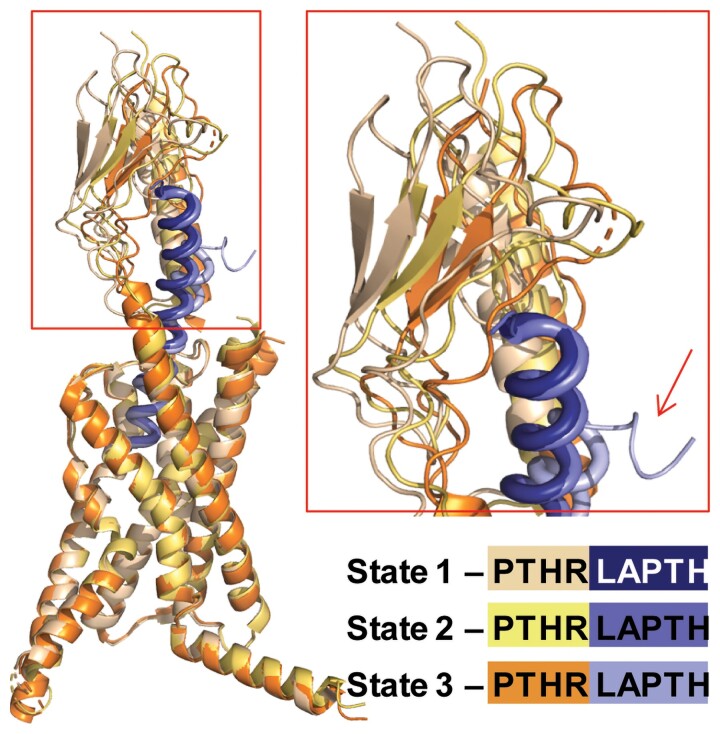
Figure 6.
Structural dynamics of LA-PTH–PTH1R complex. Overlaid 3 distinct conformational states of LA-PTH–PTH1R complex obtained from cryo-EM data analysis, aligned by TMDs. PTH1R and LA-PTH are shown as different shades of purple and orange, respectively. The oscillation of the PTH1RECD is evident (close-up view), while the TMD core shows higher degree of stability, likely due to tight binding of NLA-PTH. Notably, state 3 captures the event of partial dissociation of CLA-PTH from PTH1RECD (arrow).

