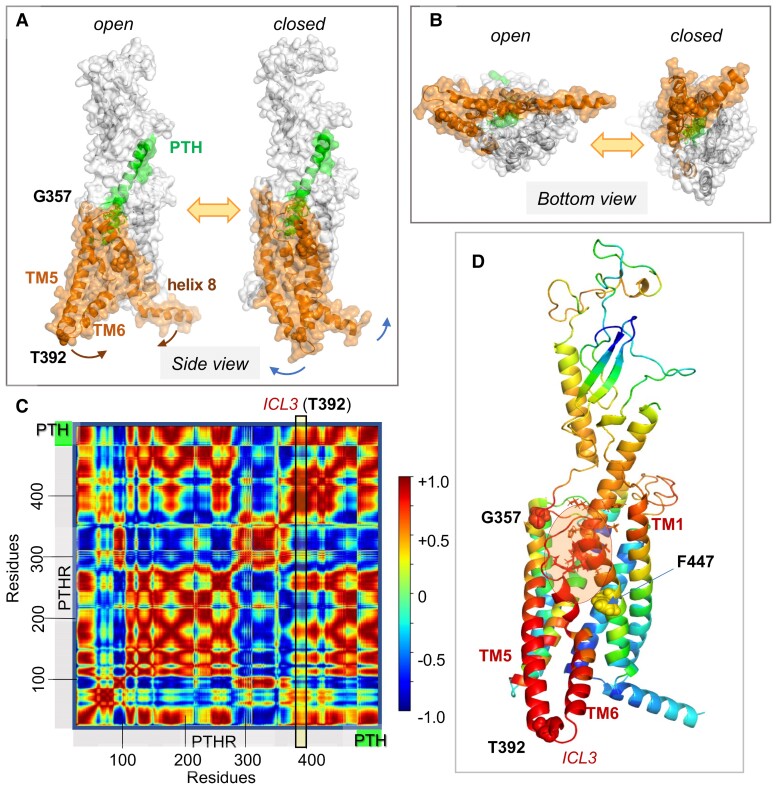
Figure 8.
PTH1R collective dynamics, inter-residue cross-correlations, and allosteric communication. (A, B) Collective motions accessible to PTH-bound PTH1R in the presence of lipid bilayer (not shown). A and B show the respective side and bottom views of 2 conformers visited during fluctuations of the complex along ANM mode 14 that cooperatively engages the entire complex (126). Here, PTH is green, PTH1R residues G357-L481, orange. Note the large swinging movements at the cytoplasmic ends of TM5-TM6 with respect to helix 8, facilitated by a disruption at TM6. Corresponding animation are in ref. (126). (C) Cross-correlation map between residue motions presented in A and B. The color code refers to the correlation cosines between the directions of motion of all residue pairs (scale bar on the right). Red and blue regions indicate the regions engaged in strongly correlated (coupled, same direction) and anticorrelated (coupled, opposite direction) movements. (D) PTH1R–PTH complex color coded by the type and strength of correlations of all movements of the residues with the TM5-TM6 cytoplasmic end (derived from the column corresponding to T392 at the ICL3 in C; see the vertical box). Red and blue residues undergo coupled same and opposite direction fluctuations with respect to T392 (or ICL3). G357, T392, and F447 are displayed in space filling. PTH V1-H14 (enclosed in a semitransparent orange ellipse, residues shown in sticks) is strongly correlated with PTHR G357-F447 (red) and the N-terminal (extracellularly exposed) part of TM1, and anticorrelated with F447-L481 (blue). Adapted from Clark et al (120).

