FIGURE 4.
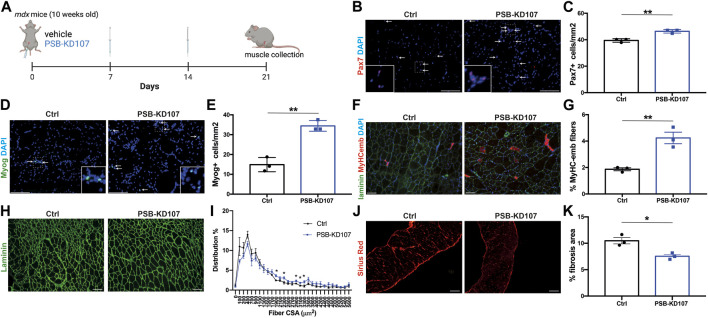
Effect of Gpr18 agonist on myogenesis in dystrophic mice. (A) Schematic showing the treatment of mdx mice with weekly injections of PSB-KD107 (1 mg/kg) or vehicle for 3 weeks (image created with biorender.com). (B) Representative micrograph showing Pax7 (MuSC marker; red) and DAPI (nuclei, blue) staining. (C) Quantification of Pax7+ cells in the muscle of PSB-KD107 or vehicle-treated mice. (D) Representative micrograph showing Myogenin (Myog, differentiated myoblast marker; green) and DAPI staining. (E) Quantification of Myog+ cells in the muscle of PSB-KD107 or vehicle-treated mice. (F) Representative micrograph showing embryonic myosin heavy chain (MyHCemb, newly formed myofiber marker; red) and laminin (to delineate myofiber border; green), and DAPI staining. (G) Quantification of the proportion of MyHCemb+ myofibers (% of total myofibers) in PSB-KD107 or vehicle-treated mice. (H) Representative micrograph showing laminin (green) staining, and (I) quantification of fiber cross-sectional area (CSA) in the TA muscle of PSB-KD107 or vehicle-treated mice. (J) Representative micrograph showing Sirius red staining visualized under polarized light (red, collagen marker), and (K) quantification of fibrosis area in the diaphragm muscle of PSB-KD107 or vehicle-treated mice. Scale bars = 100 μm. N = 3-4. Results shown as mean+/- SEM. *p < 0.05, **p < 0.01 (Unpaired t-test).

