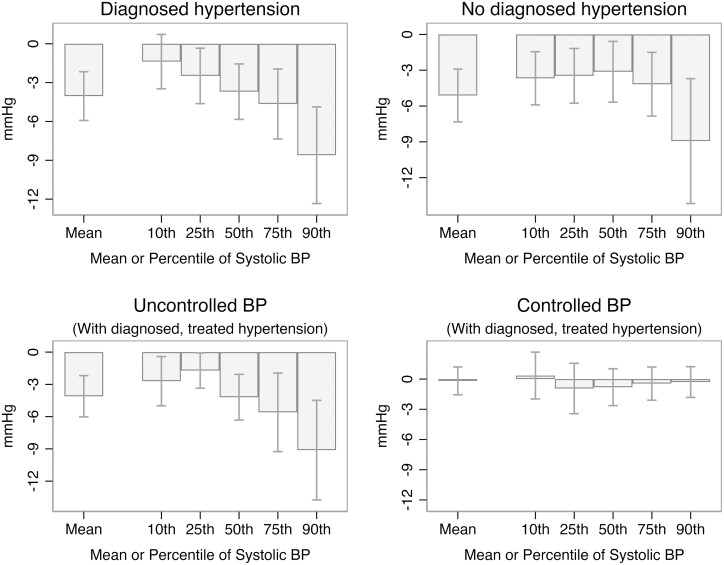
Figure 2.
Estimated associations between bachelor’s or higher (reference: less than high school) and systolic BP, stratified by hypertension diagnostic and BP control statuses. Figure shows estimated coefficients and 95% confidence intervals on bachelor’s or higher (reference: less than high school) from stratified OLS and UQR models of systolic BP that include age, age-squared, sex/gender, and race/ethnicity as covariates. Full numeric results are provided in Supplementary Tables 4–7. BP = blood pressure, measured in millimeters of mercury (mmHg); OLS = ordinary least squares; UQR = unconditional quantile regression.

