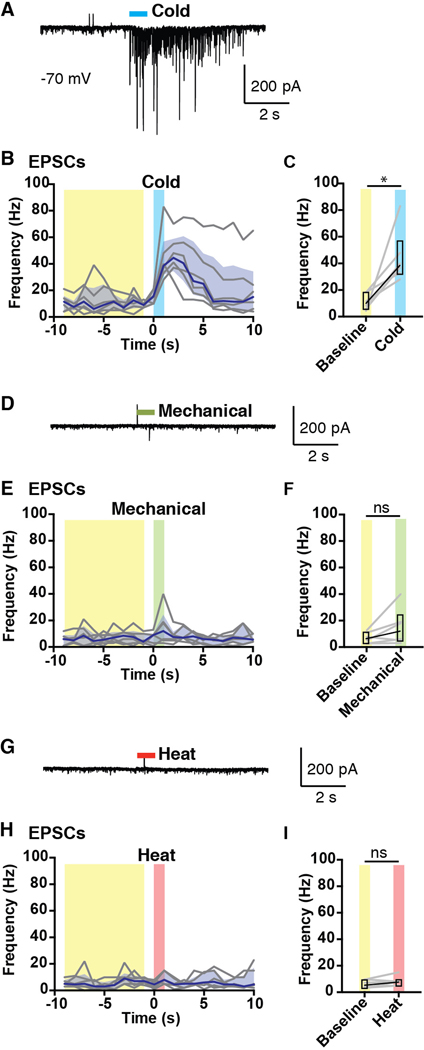
Figure 2. Cold-selective SPB neurons receive only cold input.
Analysis of EPSCs of cold-selective neurons evoked by natural stimuli. (A-C) Representative trace (A) and quantification (B-C) of EPSCs observed in response to cold (0˚ C saline). (D-F) Representative trace (D) and quantification (E-F) of EPSCs observed in response to mechanical stimulation (stiff brush or von Frey filaments, 1, 2 or 4 g)). (G-I) Representative trace (G) and quantification (H-I) of EPSCs observed in response to heat (0˚ C saline). Black lines are median, shaded area represents interquartile range, and grey lines represent data from individual cells (n = 6 SPB neurons from 6 mice). * indicates EPSC frequency over baseline period (averaged over 9 s, highlighted in yellow) is significantly different than EPSC frequency in response to cold (1 s, highlighted in blue), p < 0.05, Wilcoxon test. For mechanical (highlighted in green) and heat (highlighted in red), n.s. indicates not significant, p > 0.05, Wilcoxon test.

