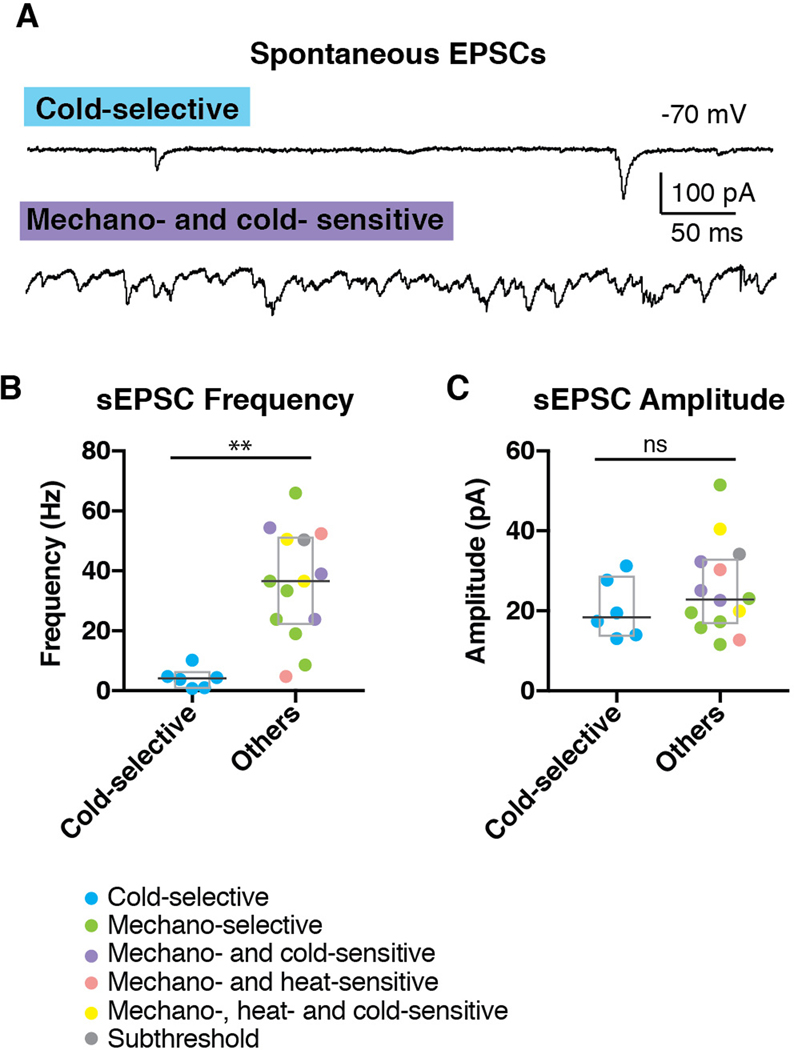
Figure 5. Cold-selective SPB neurons show few EPSCs.
(A) Representative trace of cold-selective SPB neuron (upper trace) and mechano- and cold-sensitive SPB neuron (lower trace). (B-C) Quantification of sEPSC frequency (B) and amplitude (C) of SPB neurons. Box plots are median and interquartile range with symbols representing data points from individual SPB neurons (n = 6 cold-selective SPB neurons from 6 mice and 14 other SPB neurons from 12 mice; ** indicates p < 0.01, n.s. indicates p > 0.05, Wilcoxon test).

