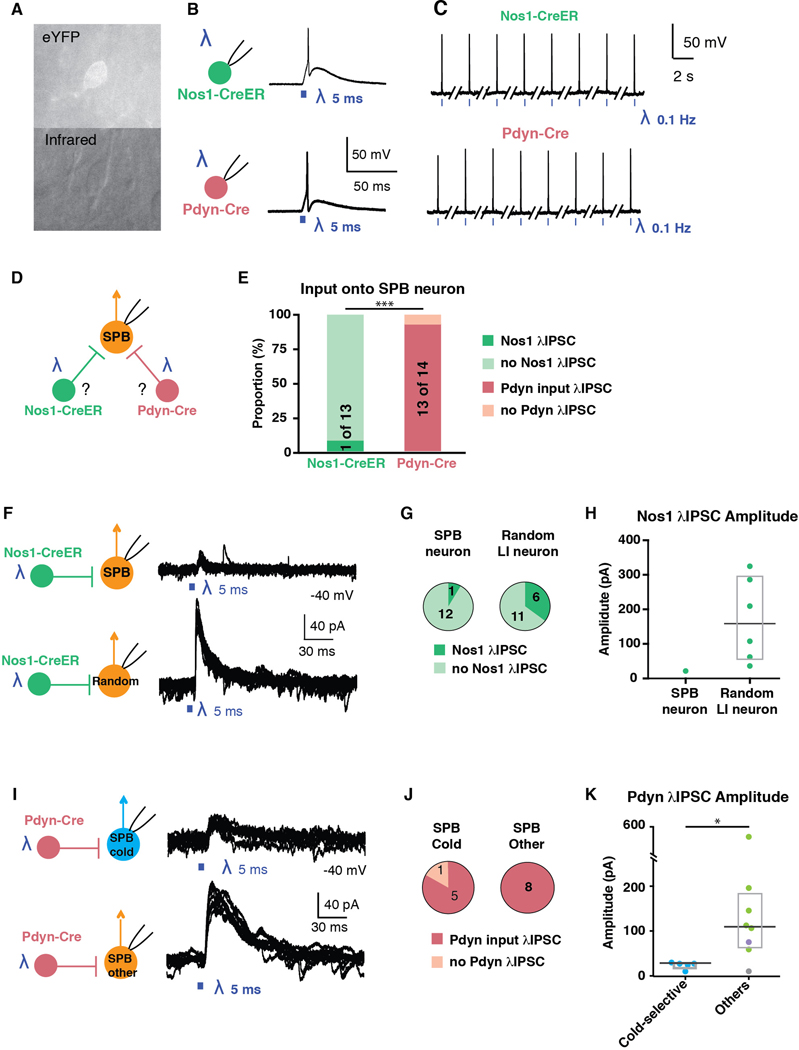
Figure 6. Cold-selective SPB neurons belong to distinct spinal circuits.
(A) Fluorescent (top) and infrared (bottom) images of a genetically-labeled neuron that is targeted for patch-clamp recordings. (B-C) Optogenetic activation of Nos1-CreER (top) or Pdyn-Cre (bottom) neurons faithfully elicits action potentials upon single (B) or repeated stimulation at 0.1 Hz (C). (D) Schematic illustrating experimental design to determine whether SPB neurons receive input from Nos1 or Pdyn inhibitory interneurons. (E) Proportion of SPB neurons that receive IPSCs in response to optogenetic activation of Nos1-CreER (green) or Pdyn-Cre inhibitory interneurons (red). *** indicates significantly different, p < 0.001, Fisher’s exact test. (F) Schematic and superimposed example traces of IPSCs of a SPB neuron (top) or a random neuron in lamina I (bottom) in response to optogenetic stimulation of Nos-CreER neurons. (G) Proportion of neurons that receive IPSCs in response to optogenetic activation of Nos1-CreER. (H) Amplitude of IPSCs observed upon optogenetic stimulation of Nos1-CreER neurons. Box plots are median and interquartile range (I) Schematic and superimposed example traces of IPSCs of a cold-selective SPB neuron (top) or other SPB neurons (bottom) in response to optogenetic stimulation of Pdyn-Cre neurons. (J) Proportion of SPB neurons that receive IPSCs in response to optogenetic activation of Pdyn-Cre neurons. (K) Amplitude of IPSCs observed upon optogenetic stimulation of Pdyn-Cre neurons. Box plots are median and interquartile range with symbols representing data points from individual SPB neurons (n = 5 cold-selective SPB neurons (blue), 6 mechano-selective neurons (green), 1 mechano- and cold-selective (purple) and 1 subthreshold (grey).) * indicates significantly different, p < 0.05, Wilcoxon test.

