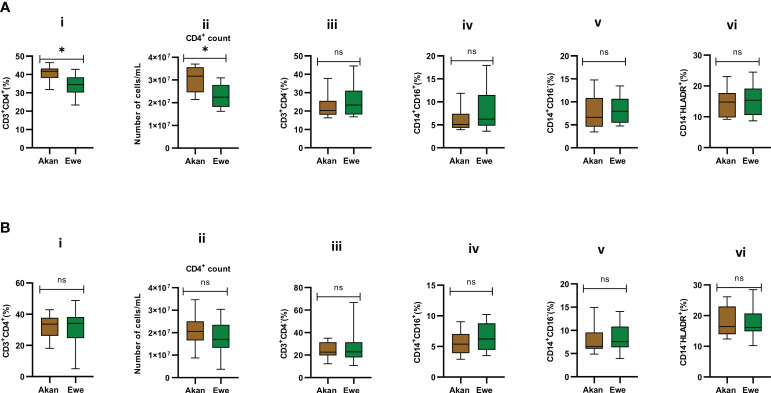
Figure 3.
Comparison of the cellular composition of PBMCs from participants. Phenotypic and quantitative characterization of cells in PBMCs of (A) healthy controls [Akan, n = 10; Ewe, n = 10] and (B) cured TB cases [Akan, n = 18; Ewe, n = 15] of the two ethnic groups. Significant difference was observed only in the proportions (p = 0.02) and counts of CD3+CD4+ cells (p = 0.02) among the two ethnic groups using Mann–Whitney test. PBMCs, peripheral blood mononuclear cells; TB, tuberculosis. *p-value ≤ 0.05; ns, not significant (statistically), that is, p-value > 0.05.

