Figure 1.

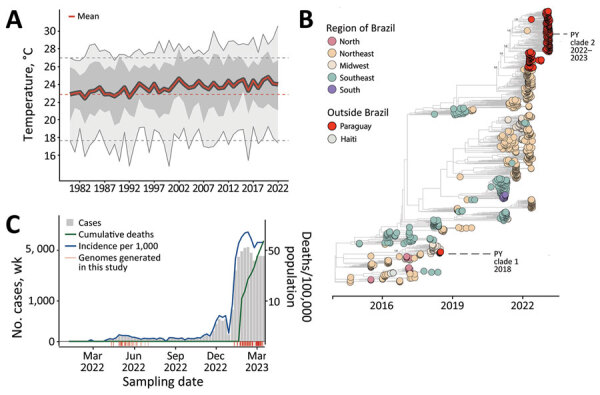
Spatial and temporal distribution of cases of chikungunya in Paraguay. A) Temperature trends during 1981‒2022. Yearly mean (red line), yearly minimum and maximum (light gray shading), yearly 50% quantiles (dark gray shading), minimum and maximum temperatures in 1981 (dashed gray lines) and mean temperature in 1981 (dashed red line) are shown. B) Number of chikungunya virus genome sequences in Paraguay compared with Brazil (by region) and Haiti. Size of circles indicates number of new genomes generated in this study. C) Weekly reported chikungunya cases (gray area), incidence normalized per 100,000 persons (blue line), and cumulative deaths (green line -or other color if you need to change this line color) during 2022–2023 (through epidemiologic week 11). Red bars indicate dates of sample collection of genomes generated in this study.
