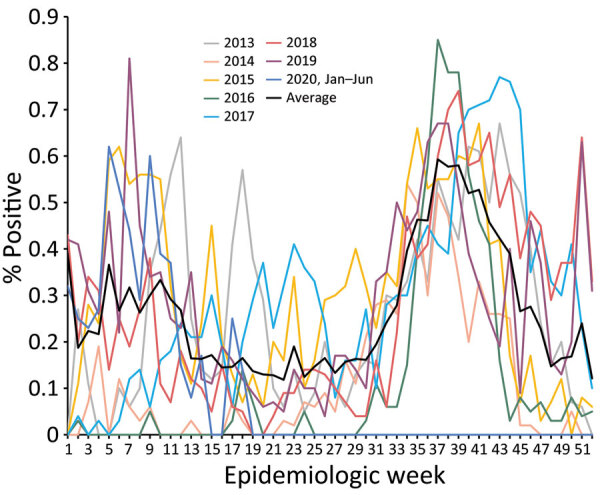
Figure 2.

Prepandemic average epidemic curves used to demonstrate shifting patterns of influenza circulation during the COVID-19 pandemic, Senegal. Graphs show annual and overall average percentage of influenza-positive reverse transcription PCR tests per epidemiology week reported by the sentinelle syndromique du Sénégal (sentinel syndromic surveillance of Senegal), also known as the 4S Network, during January 2013–January 2020.
