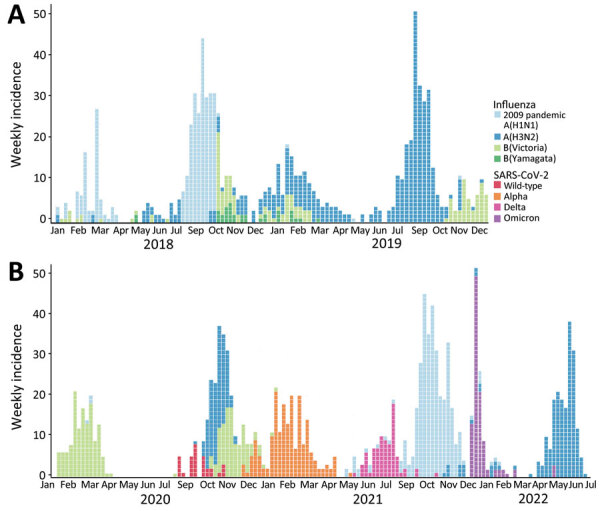
Figure 5.

Number of reverse transcription PCR (RT-PCR)–positive samples per week in a study of shifting patterns of influenza circulation during the COVID-19 pandemic, Senegal. Data represent RT-PCR–positive tests per epidemiologic week reported by the sentinelle syndromique du Sénégal (sentinel syndromic surveillance of Senegal), also known as the 4S Network, including influenza subtypes and SARS-CoV-2 variants. A) Weekly influenza incidence during the prepandemic period, January 2018–2019. B) Weekly influenza and SARS-CoV-2 incidence during the pandemic period, January 2020–July 2022.
