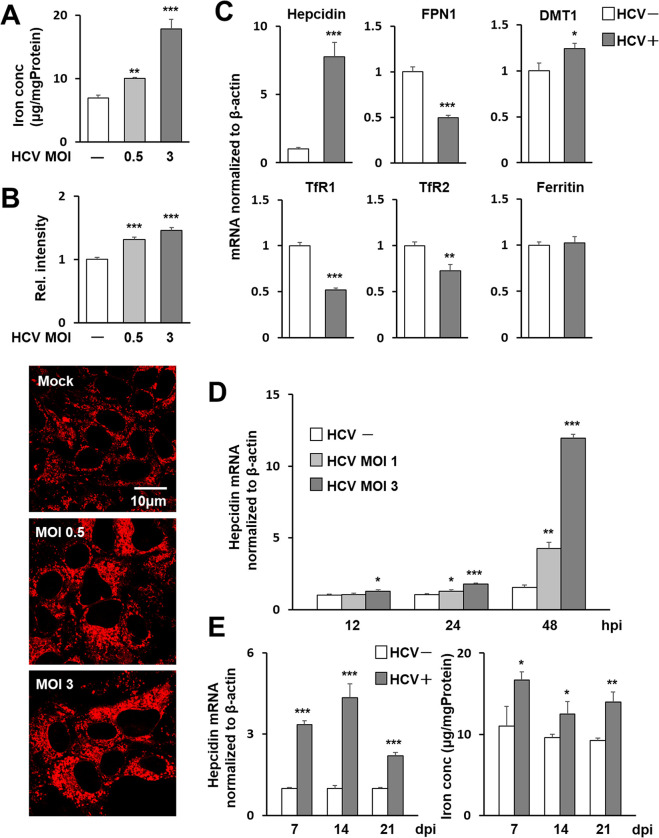
Fig 1. Induction of hepcidin gene expression and intracellular iron accumulation by HCV infection.
Iron concentrations in HCV-infected Huh7.5.1 cells 3 days post-infection (dpi) at MOIs of 0, 0.5, and 3 were evaluated through (A) measurement of Fe2+ and Fe3+ in cell lysates using the Nitroso-PSAP method and (B) measurement of relative intensity corresponding to Fe2+ using the fluorescent probe FeRhoNox-1. (B) For each group, cytoplasmic luminescence intensities of cells stained with the fluorescence probe were measured in Huh7.5.1 cells and the relative intensities were graphed with the average intensity of the uninfected-cell group as 1. Representative images of the cells used to measure luminescence intensities are shown at the bottom of the graph. (C) mRNA expressions of hepcidin, FPN1, DMT1, TfR1, TfR2 and ferritin in infected cells 3 dpi (MOI = 0.5, HCV+) and cells without infection (HCV-) were analyzed using qRT-PCR. (D) Time-course changes in hepcidin gene expression induced by HCV infection at MOIs of 1 and 3 were determined. At 12, 24, and 48 hpi, hepcidin mRNA was quantified as above. (E) In long-term cultures of infected cells, hepcidin mRNA was measured at 7, 14, and 21 dpi at MOI of 0.5. Values obtained from mock-infections at each point were set as 1. Intracellular iron concentrations were determined by the Nitroso-PSAP. (A)-(E) Results represent the means with SD from three independent measurements. Student’s t test; *P<0.05, **P<0.01, ***P <0.001.

