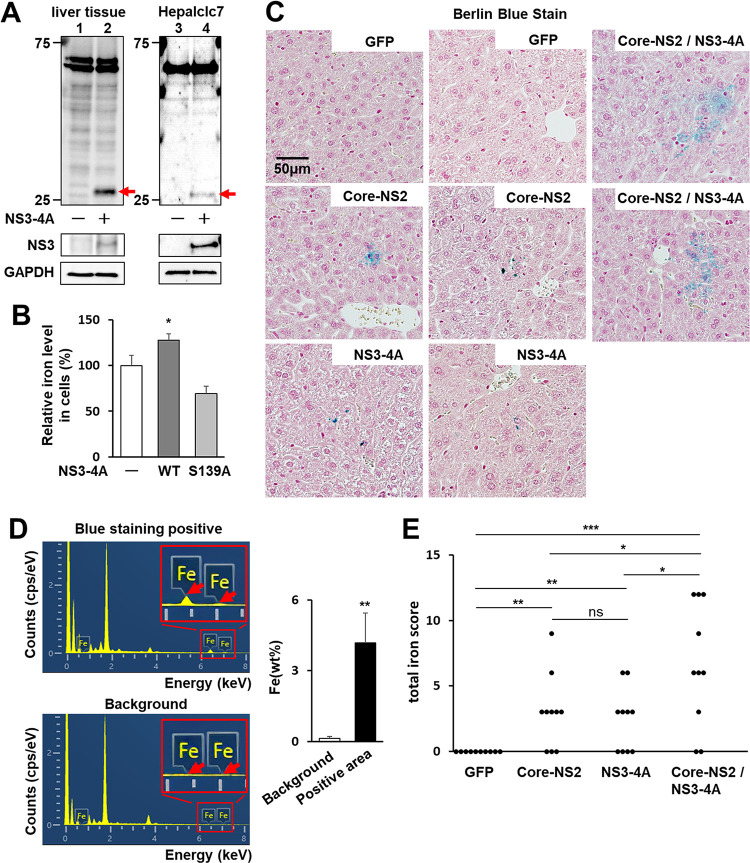
Fig 5. Iron store levels in mouse liver tissues and in cultured cells expressing HCV proteins.
(A) Eight-week-old male WT mice were intravenously injected with AdV expressing either GFP or NS3-4A genotype 1b. At 5 dpi, liver tissues were subject to western blotting to detect FPN1 and its cleaved form (red arrow) and HCV NS3 (left). Hepalclc7 cells transfected with the NS3-4A-expressing plasmid or the EV (right). (B) Iron concentrations in cells transfected with the plasmid expressing FPN1 together with the expression plasmid for NS3-4A WT or S139A mutant or EV were measured using the PSAP-method. Mean values obtained from transfectants with the FPN1-plasmid and EV were set as 100%. Results represent the means with SD from three independent measurements. Student’s t test; *P<0.05, **P<0.01. (C) Four groups of mice (N = 4 each) were created in which recombinant adenoviruses were injected as follows: GFP group as a negative control; AdEFLNLGFP, AdEFNCre and AdEFGFP, Core-NS2 group; AdEFLNLHCVCore/NS2 and AdEFNCre, NS3-4A group; AdEFHCVNS3/4A, Core-NS2 and NS3-4A group; AdEFLNLHCVCore/NS2, AdEFNCre and AdEFHCVNS3/4A. Thin section slices were prepared from livers at 5 dpi and stained with Berlin blue. Representative images of two mouse livers from each group are shown. (D) Elemental analysis was performed with the NanoSuit method at the six spots positive for staining (Blue staining positive) and unstained parts (Background) in slices from the Core-NS2 group described in S13 Fig. (Left) Elemental composition graphs of energy (keV) vs. cps per eV are shown. Areas including the Fe peaks in the sample positive for blue staining and the corresponding area in the background sample are expanded. (Right) The weight concentrations of Fe measured were quantified and are expressed as weight percentages (wt%). Student’s t test; **P<0.01. (E) Total iron scores of 10 fields of view in the livers from the four groups described in (C) were individually evaluated by means of histological hepatic iron index. Results represent the plots separately for each group. Welch’s t test; *P<0.05, **P<0.01, ***P<0.001, ns P>0.05.

