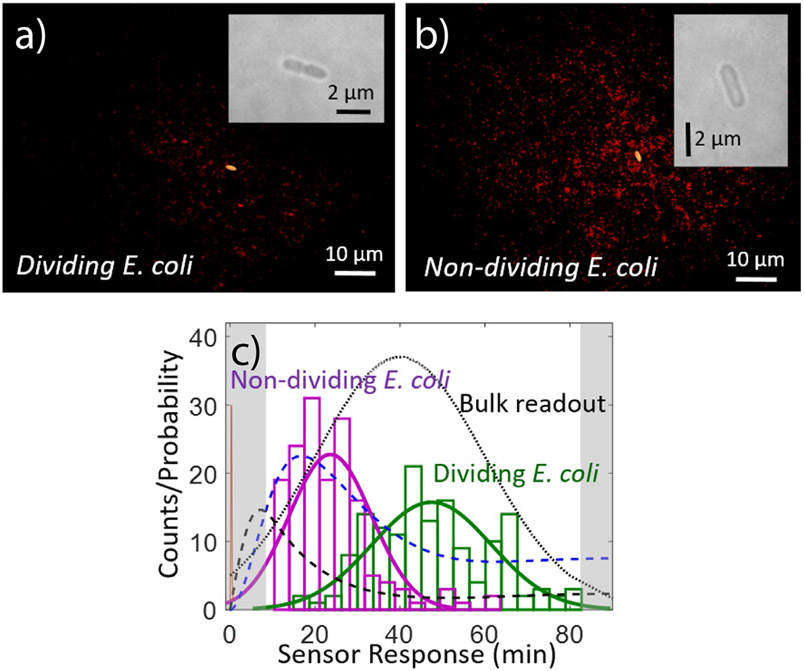
Fig. 4.
Protein secretion footprint imaging. Typical NIR protein footprint (red), as measured with a RAP1 SWNT nanosensor array 1h post-induction of E. coli cells with aTc for (A) a dividing E. coli cell and (B) a non-dividing cell (bright-field insets). Dividing cells show a noticeably smaller protein secretion footprint than non-dividing cells (154.0 ± 69.2 versus 486.2 ± 113.0 protein-responding sensors, respectively). (C) Quantification of first-response times for each nanosensor under each cell for N = 22 individual protein secretion events for dividing (green) or non-dividing (magenta) cells. As measured by the sensor array, a faster first-protein-secretion events are measured for non-dividing cells. Kinetic model for the protein secretion pathway for RAP1 secretion: aTc diffusion to the cell (red spike), protein transcription (mRNA concentration, dashed black), and protein translation (protein concentration, dashed blue). The black dotted line models the expected protein content in the cell supernatant if measured using an SDS-PAGE gel to monitor for protein band intensity (Landry et al., 2017).

