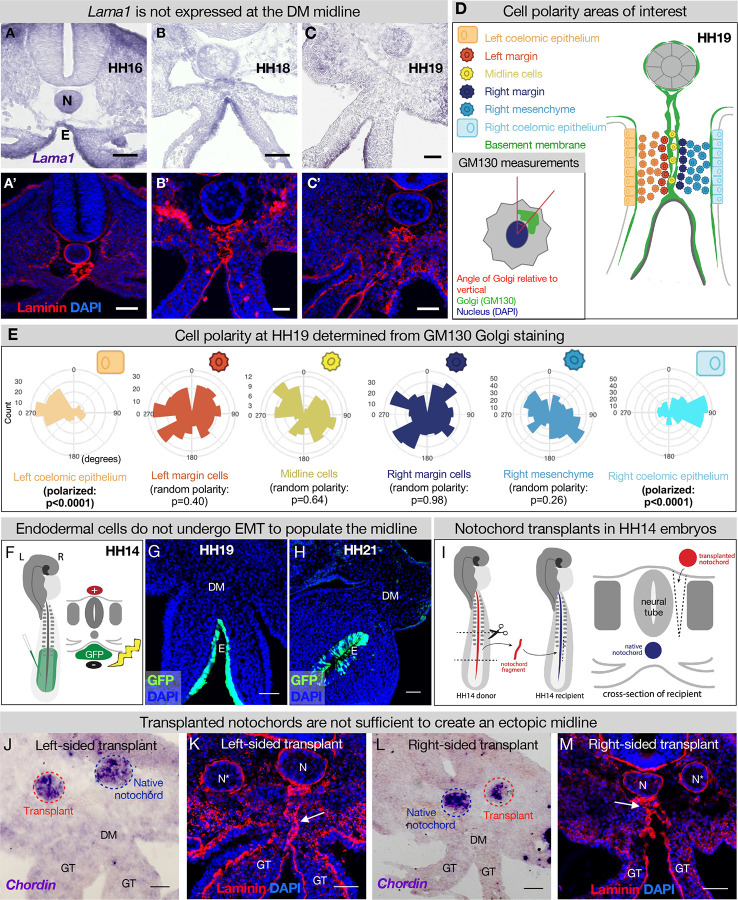
Figure 4. The midline basement membrane is not made by the DM mesenchyme or EMT of the endoderm, and the notochord is not sufficient for midline formation.
(A-C) Lama1 RNA in situ hybridization and adjacent sections with laminin IF staining at HH16 n = 3, HH18 n = 9, and HH19 n = 10 (A’-C’). Scale bars = 50 μm. (D, E) Cell polarity analysis from GM130 staining shows that the mesenchymal cells immediately to the left or right of the midline (“left/right margin”) and within the double membrane (“midline cells” have random polarity, as do the cells of the right mesenchyme (random polarization control); in contrast to the strong apical-basal polarity in cells of the left coelomic epithelium. Five embryos were used for these quantifications. Number of cells per circle histogram: left coelomic epithelium = 209, left margin = 346, midline cells = 118, right margin = 413, right mesenchyme = 514, right coelomic epithelium = 295. (F) Electroporation mix containing pCAGEN-GFP plasmid was injected under an HH14/15 embryo and then electroporated to specifically target the endoderm. Lineage tracing endoderm-derived cells to HH19 n = 8 (G) and HH21 n = 2 (H) by pCAGEN-GFP electroporation of the endoderm. (I) Model of notochord transplant method. A piece of notochord (red) was isolated from an HH14 donor embryo. In a stage-matched recipient, a cut was made adjacent to the neural tube and the donor notochord was inserted into this slit. (J, L) RNA in situ hybridization for Chordin to mark the native notochord (blue dashed circle) and transplanted notochord (red dashed circle). (K, M) Laminin immunohistochemistry to mark basement membrane including the midline (white arrow). Notochords are marked with an N (native notochord) and N* (transplanted notochord). (J) and (K) are from the same embryo, as are (L) and (M). n = 8, scale bars = 50 μm. GT = gut tube, DM = dorsal mesentery, E = endoderm.

