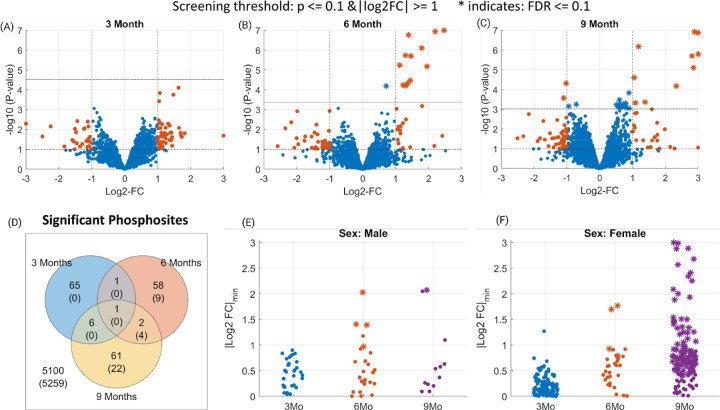
Figure 1. Phosphosites identified as differentially phosphorylated for Alzheimer’s disease at different time points.
(Panels A-C) Volcano plots indicating the screened phosphosites with high or low phosphorylation at 3/6/9 month time points. The dashed horizontal lines in each plot indicate the statistical significance threshold (p<0.1 and FDR ≤ 0.1) and the vertical line the threshold on fold changes (>2). The statistically significant phosphosites at FDR ≤ 0.1 level are marked as stars (*). (Panel D) Venn diagram showing the number of phosphosites that pass the screening (p ≤ 0.1 and 0.5 ≥ FC ≥ 2) for 3/6/9 months data. Whereas, the numbers in parenthesis indicate the significant ones at FDR ≤ 0.1 level. (Panels E-F) Identified phosphosites that pass the screening in sex-specific analysis. The y-axis indicates a lower-bound of the 95% confidence intervals for each phosphosite.

