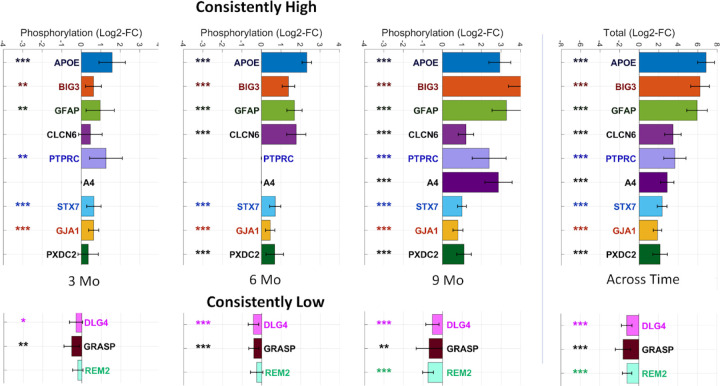
Figure 2. Proteins identified as differentially phosphorylated for Alzheimer’s disease across different time-points.
(Left panel) The bars indicate the mean phosphorylation for each protein identified as consistently phosphorylated and the error bars indicate 95% confidence intervals. Proteins are marked according to their statistical significance levels: * for p ≤ 0.1, ** for FDR ≤ 0.1 and *** for FDR ≤ 0.01.

