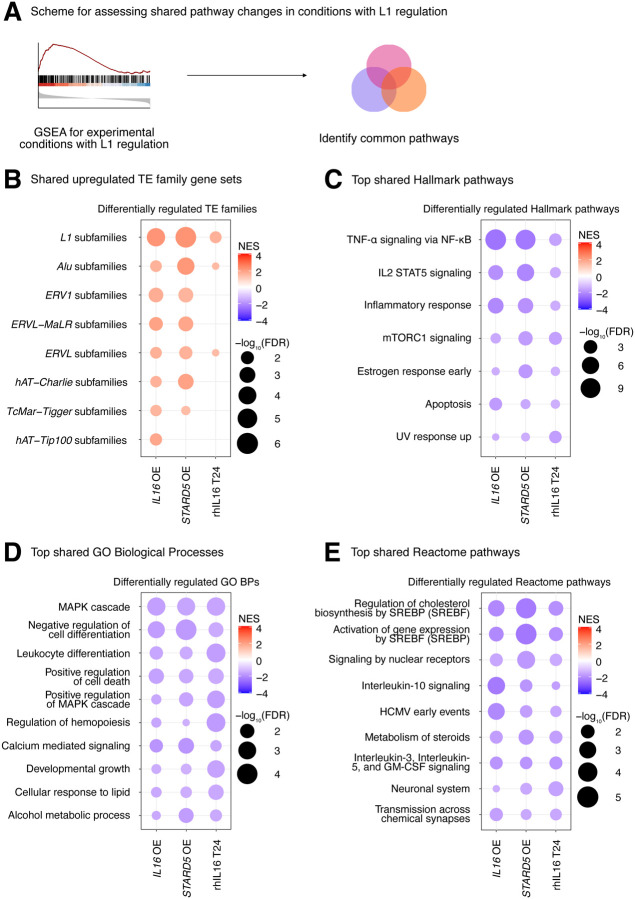
Figure 6. Consistent cellular responses to IL16 overexpression, STARD5 overexpression, and rhIL16 exposure for 24 hours.
IL16 overexpression, STARD5 overexpression, and rhIL16 exposure for 24 hours are associated with subtle but widespread differences in TE families and known TE-associated pathways. (A) Scheme for assessing concordantly regulated TE family and pathway gene sets across conditions where an L1 gene set is upregulated. GSEA analysis for top, shared, concomitantly regulated (B) TE family, (C) MSigDB Hallmark pathway, (D) GO Biological Process, and (E) Reactome pathway gene sets following IL16 overexpression, STARD5 overexpression, and rhIL16 exposure for 24 hours. Shared gene sets were ranked by combining p-values from each individual treatment analysis using Fisher’s method. In each bubble plot, the size of the dot represents the −log10(FDR) and the color reflects the normalized enrichment score. FDR: False Discovery Rate.

