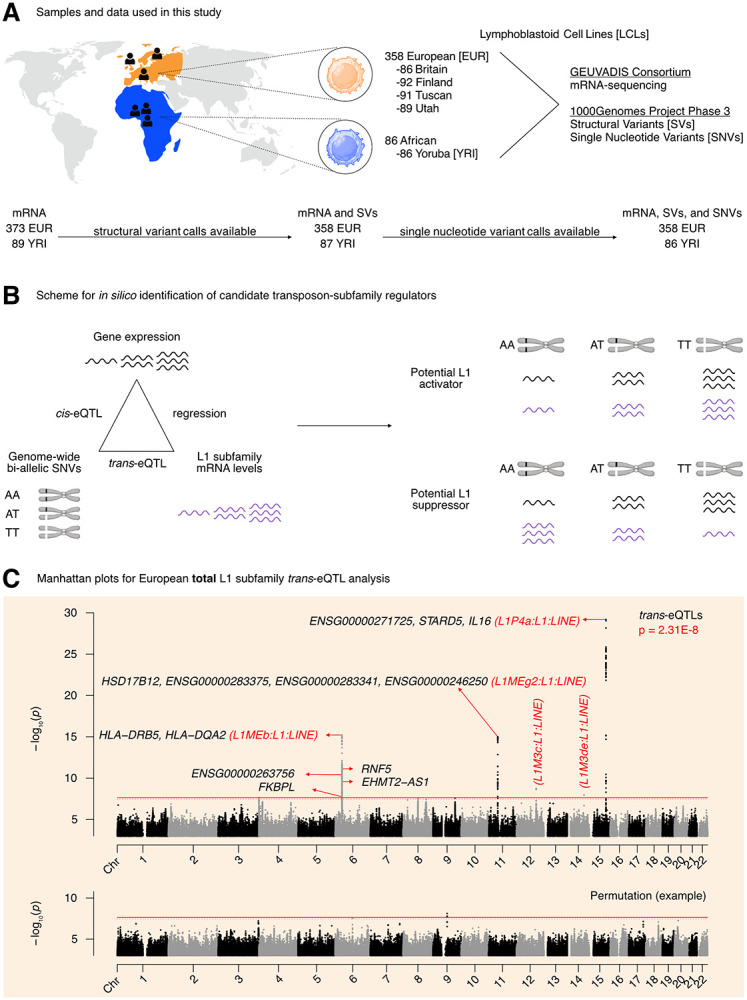
Figure 1. Overview of the pipeline developed to scan for L1 transcriptional regulators in silico.

(A) An illustration of the samples and “omic” data used in this study. Of the 358 European individuals, 187 were female and 171 were male. Of the 86 African individuals, 49 were female and 37 were male. (Note that Utah subjects are of Northern European ancestry, and thus part of the European cohort for analytical purposes). (B) A schematic illustrating how genetic variants, gene expression, and TE expression can be integrated to identify highly correlated SNV-Gene-TE trios. (C) A Manhattan plot for the L1 subfamily trans-eQTL analysis in the European cohort. The genes that passed our three-part integration approach are listed next to the most significant trans-eQTL SNV they were associated with in cis. The dashed line at p = 3.44E-8 corresponds to an average empirical FDR < 0.05, based on 20 random permutations. One such permutation is illustrated in the bottom panel. The solid line at p = 2.31E-8 corresponds to a Benjamini-Hochberg FDR < 0.05. The stricter of the two thresholds, p = 2.31E-8, was used to define significant trans-eQTLs. FDR: False Discovery Rate. Some panels were created with BioRender.com.
