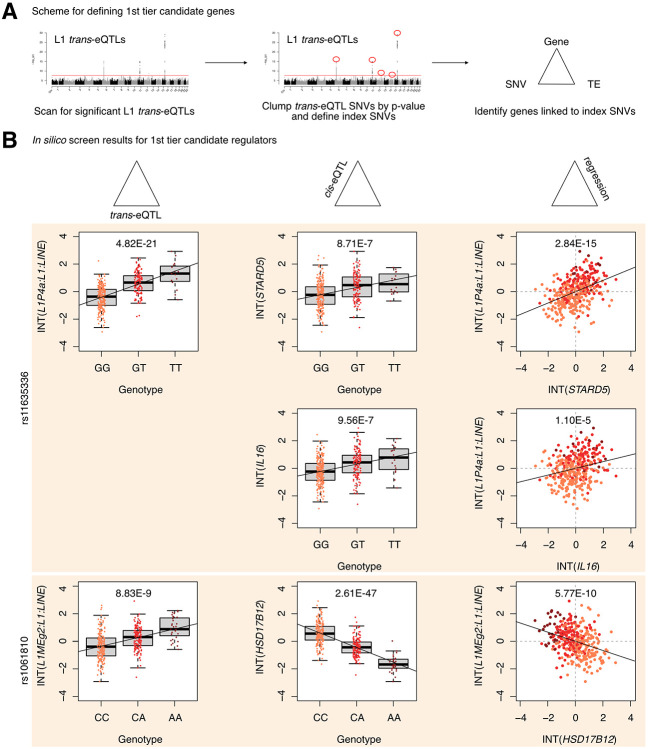
Figure 2. Identification of 1st tier candidate L1 expression regulators in the European cohort.
(A) A schematic for how 1st tier candidate genes were defined. In short, these were genes in trios with index SNVs that were at the top of their respective peak. (B) The three-part integration results for three protein-coding genes—STARD5, IL16, HSD17B12—that we considered first tier candidates for functional, in vitro testing. In the left column are the trans-eQTLs, in the middle column are the cis-eQTLs, and in the right column are the linear regressions for gene expression against L1 subfamily expression. Expression values following an inverse normal transform (INT) are shown. The FDR for each analysis is listed at the top of each plot. FDR: False Discovery Rate.

