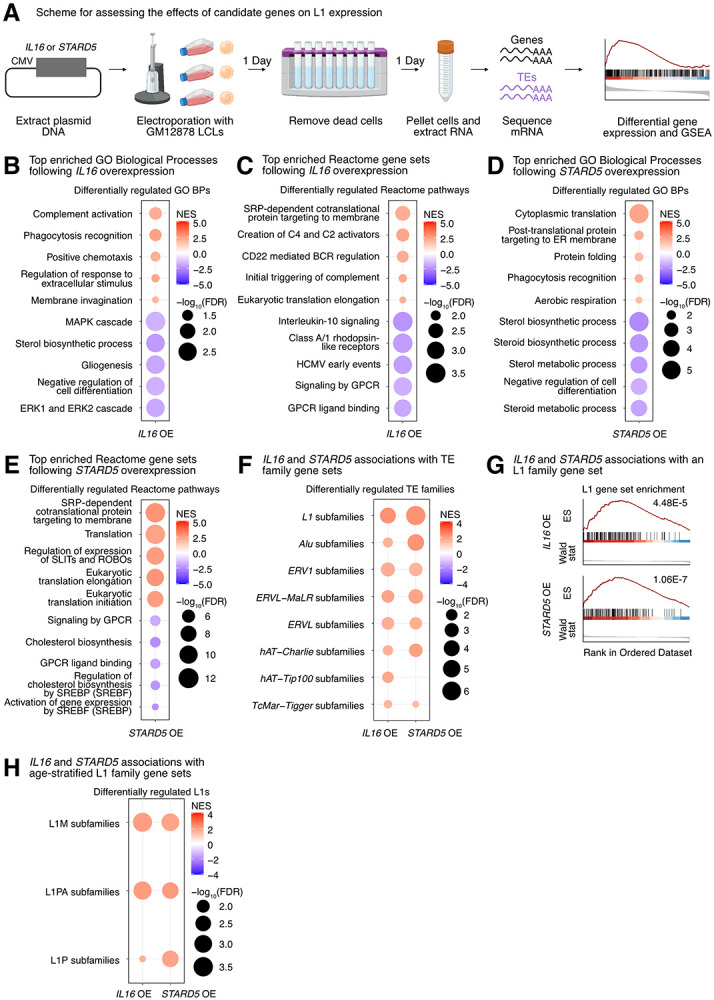
Figure 4. Impact of IL16 and STARD5 overexpression on LCL gene and TE expression landscapes.

IL16 and STARD5 overexpression induce changes consistent with their known biology, as well as subtle but widespread upregulation of TE families. (A) Scheme for experimentally validating the roles of IL16 and STARD5 in L1 regulation. GSEA analysis for top, differentially regulated (B) GO Biological Process and (C) Reactome pathway gene sets following IL16 overexpression. GSEA analysis for top, differentially regulated (D) GO Biological Process and (E) Reactome pathway gene sets following STARD5 overexpression. (F) GSEA analysis for shared, significantly regulated TE family gene sets following IL16 and STARD5 overexpression. (G) GSEA plots for the L1 family gene set results summarized in (F). For these plots, the FDR value is listed. (H) GSEA analysis for shared, significantly regulated, evolutionary-age-stratified L1 gene sets across IL16 and STARD5 overexpression. L1M subfamilies are the oldest, L1P subfamilies are intermediate, and L1PA subfamilies are the youngest. In each bubble plot, the size of the dot represents the −log10(FDR) and the color reflects the normalized enrichment score. FDR: False Discovery Rate. Some panels were created with BioRender.com.
