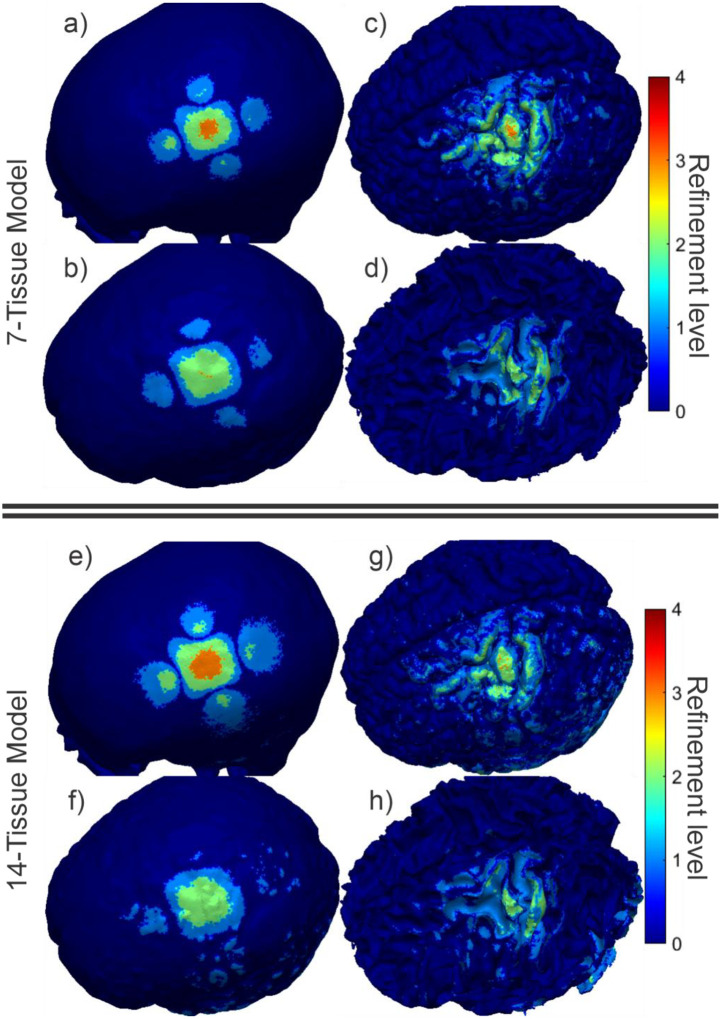
Fig. 4:
(a-d): TES AMR maps for bone, CSF, GM, and WM (respectively) for the 7-tissue model of Connectome Subject 122620. The color map indicates the number of refinement steps that were applied to subdivide a facet of the initial model into a given facet of the refined model. The current paths beneath the electrodes are clearly visible in the refinement levels of the skull and CSF. (e-h): AMR maps for the same tissues for the 14-tissue model.

