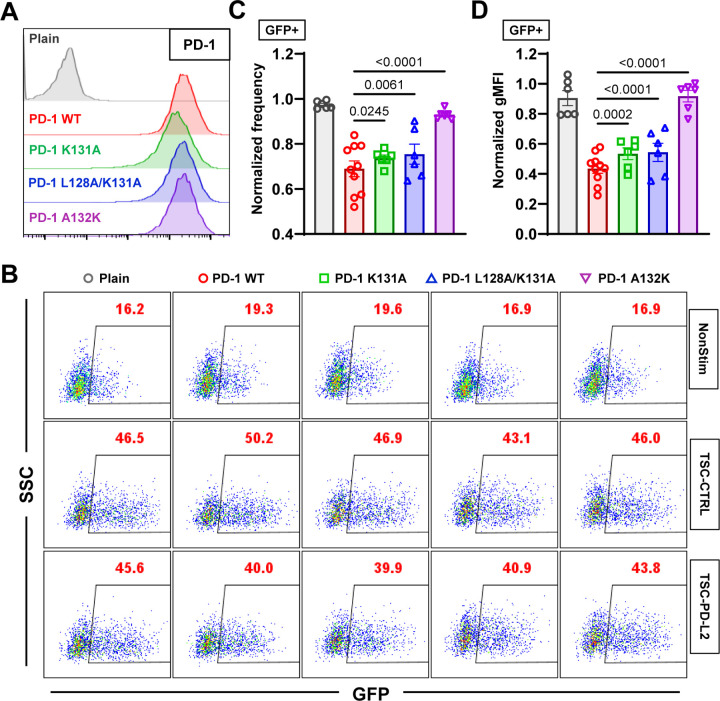
Fig. 6.
PD-1 mutants with impaired PD-1–PD-L2 mechanical stability demonstrate reduced inhibitory function. (A) Flow cytometry histograms comparing PD-1 staining of NFκB::eGFP reporter Jurkat cells expressing no, WT, or indicated mutants of PD-1. (B) Representative SSC vs GFP plots of reporter Jurkat cells 24 hr after stimulation with indicated conditions. (C-D) Quantification of GFP expression for conditions in B. Normalized frequency (C&G) and normalized geometric mean fluorescence intensity (gMFI) (D&H) were calculated as (sample – averaged background)/(anti-CD3 control – averaged background). n = 6 for plain, PD-1 K131A, L128K/K131A, and A132K pooled from 3 independent experiments or n = 10 for PD-1 reporter cells pooled from 5 independent experiments. Numbers on graphs represent p values calculated from two-tailed student t-test.

