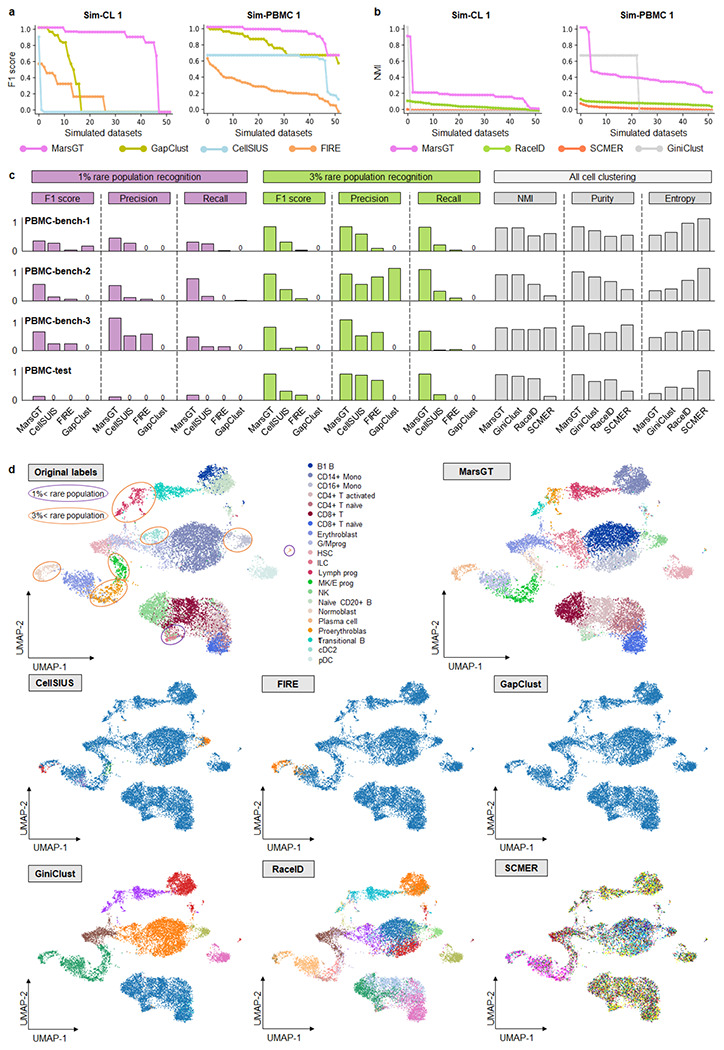
Fig. 2. Benchmarking of MarsGT in terms of rare cell population identification.

a. Benchmark rare cell population identification on Sim-CL 1 and Sim-PBMC 1 datasets with classification-like tools in terms of F1 score. The X-axis signifies the dataset, while the Y-axis presents F1 scores arranged in descending order. b. Rare cell population identification on Sim-CL 1 and Sim-PBMC 1 datasets benchmarked with clustering-like tools evaluated via NMI scores. The X-axis signifies the dataset, while the Y-axis denotes NMIs, organized in descending order. c. Comparative results on three real training datasets (PBMC-bench-1, 2, 3) and one independent test dataset (PBMC-test). Test parameters across all tools are determined by the most optimal results obtained from the training dataset. d. The UMAPS results for the independent PBMC-test dataset were calculated using PCA and predicted cell clusters in the tools. The purple and orange ellipses represent rare cell populations constituting less than 1% and 3%, respectively. Tools like FIRE and GapClust can distinguish only between major and rare populations in a binary fashion based on their method design. CellSISU, due to its design, can identify several rare cell populations but cannot recognize major ones.
