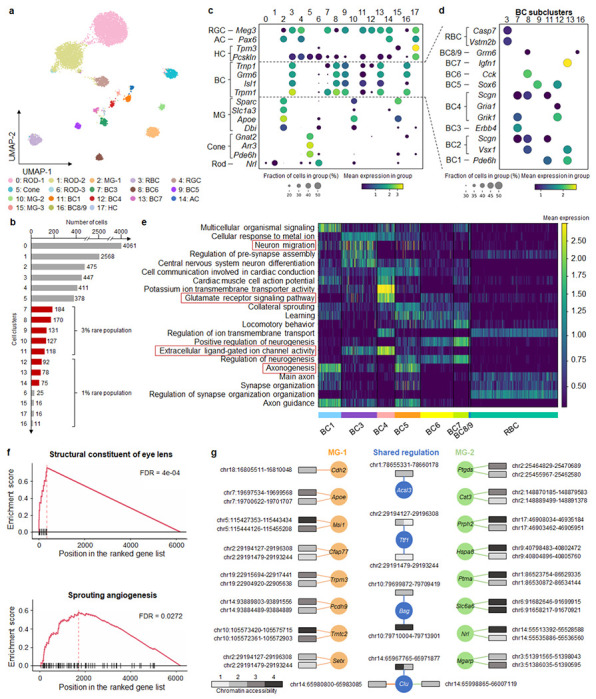
Fig. 3. MarsGT effectively captures differential regulatory mechanisms and uncovers biologically meaningful rare cell populations often missed by other tools.

a. A UMAP visualizing the cell clusters predicted by MarsGT, annotated based on marker genes. b. The number of cells in each cell cluster, with the red color signifying a 95% confidence level for rare cell populations. c. Dotplot depicts the expression value and proportion of marker genes for the cell clusters predicted by MarsGT. d. Dotplot represents the expression value and proportion of BC marker genes for the cell clusters predicted by MarsGT. e. The average gene expression across each pathway is calculated using differentially expressed genes (DEGs) across various BC subpopulations. Pathways within the red box have been validated in the literature. f. Pathway enrichment as determined by Gene Set Enrichment Analysis (GSEA), based on the DEGs of MG-1 and MG-2. The structural constituent of the eye lens is the pathway enriched in MG-2, and Sprouting angiogenesis is the pathway enriched in MG-1. g. The different peak-gene networks of MG-1 and MG-2. Rectangles symbolize the peaks, and their colors represent the mean accessibility of the peak in the cell population. Accessibility levels ranging from 0 to 0.1 are denoted as 1, those from 0.1 to 0.5 as 2, from 0.5 to 1 as 3, and anything above 1 is denoted as 4. The color of the line and circle represent the cell populations. The orange color signifies genes or relationships unique to MG-1, green indicates those unique to MG-2, while blue represents genes or relationships shared between MG-1 and MG-2.
