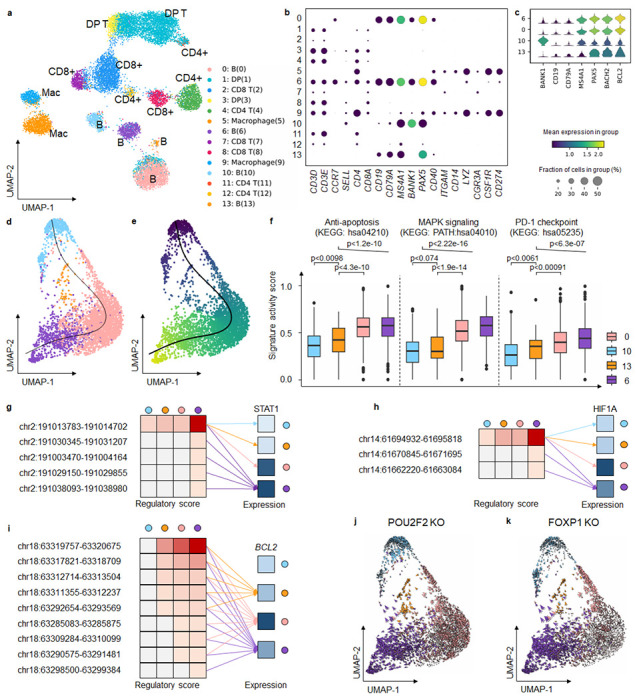
Fig. 4. MarsGT identifies the rare cells in the intermediate transition state on B lymphoma data.

a. UMAP visualizes cell clusters predicted by MarsGT, annotated based on the marker genes. b. Dotplot demonstrates the expression value and proportion of marker genes within the cell clusters predicted by MarsGT. c. A stacked violin plot represents the subpopulations of B cells, annotated with the marker genes for both normal and tumorous B cells. d. A cell development trajectory for the four B cell subpopulations, with the line representing the lymphoma development trajectory. e. The pseudotime of the four B cell subpopulations. f. The pseudotime of the four B cell subpopulations. Color represents cell clusters, and the Y-axis is the enrichment score. g. The regulatory relationship of the PDL1 gene across the four B cell subpopulations. The red color signifies the regulatory score for each enhancer of the STAT1 coding gene across different B cell subpopulations, while blue indicates gene expression. h. The regulatory relationship of the PDL1 gene across the four B cell subpopulations. The red color signifies the regulatory score for each enhancer of the HIF1A coding gene across different B cell subpopulations, while blue denotes gene expression across these subpopulations. i. The regulatory relationship of the BCL2 gene (an anti-apoptosis promoting gene) across the four B cell subpopulations. The red color represents the regulatory score of each enhancer for the BCL2 coding gene across different B cell subpopulations, while the blue color represents gene expression in these subpopulations. j. Observed and extrapolated future states (depicted as arrows) following the POU2F2 knockout in the four B cell subpopulations. The color represents the different cell clusters. k. Observed and extrapolated future states (depicted as arrows) following the FOXP1 knockout in the four B cell subpopulations. The color represents the different cell clusters.
