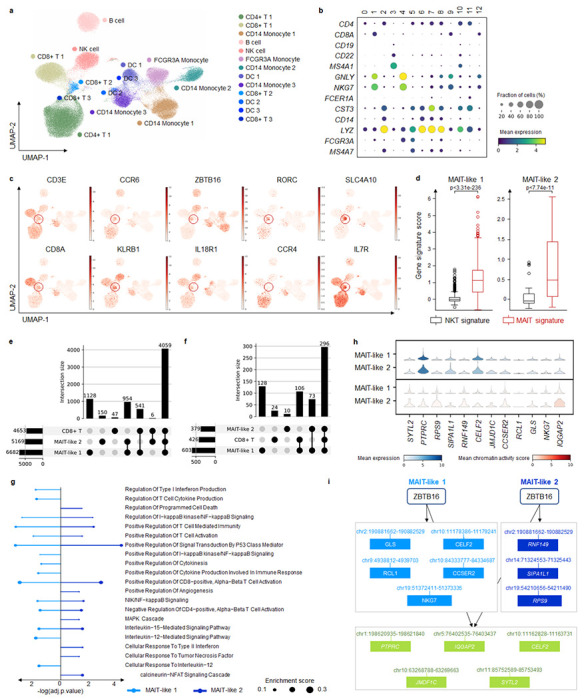
Fig. 5. MarsGT identifies MAIT-like rare cell populations and eGRNs in multi-sample melanoma scRNA-seq and scATAC-seq.

a. UMAP visualizes MarsGT’s predicted cell cluster results, annotated based on marker genes. b. Dotplot depicts the expression value and proportion of marker genes within the cell clusters predicted by MarsGT. c. UMAPS showcases the marker genes of MAIT cells. d. showcasing the marker genes of MAIT cells. The p-value is calculated by the Mann-Whitney U test with one-sided. e. The upset plot illustrates the peaks present in CD8+ T cell subpopulations. f. The upset plot demonstrates the genes found in CD8+ T cell subpopulations. g. Pathway enrichment across different MAIT-like cell populations. Colors represent distinct cell populations, while the size of the dots indicates the ratio of enriched genes. h. The expression and accessibility of ZBTB16-regulated genes across various MAIT cell populations. i. The regulatory relations of ZBTB16 in different MAIT-like cell populations. Green means the common regulatory relations between MAIT-like 1 and MAIT-like 2. Light blue means the regulatory relations unique in MAIT-like 1. Dark blue means the regulatory relations unique in MAIT-like 2.
