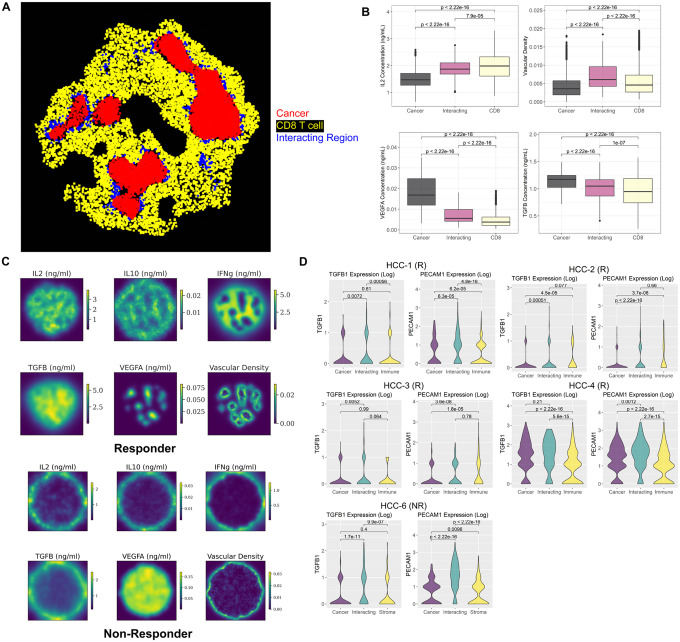
Fig 5. Spatial region identification and comparison with spatial transcriptomic analysis.
A) The SpaceMarkers algorithm identified cellular hotspot regions of tumor and immune interactions in a simulated responder sample at day 70. B) Comparison of simulated cytokine concentration in the cancer cell region, CD8+ T cell region, and interacting region Identified in panel A using Kruskal-Wallis test. C) Simulated spatially resolved cytokine concentration and vascular density distribution for a responder and a non-responder sample at day 70. D) Expression of TGFβ and endothelial cell marker (PECAM1) in 5 spatial transcriptomic samples (4 responders and 1 non-responder) obtained from post-treatment surgical biospecimens in the phase 1b clinical trial. The DE model of the SpaceMarkers algorithm is applied to every sample to identify gene expression changes associated with interactions between cancer and immune cells.

