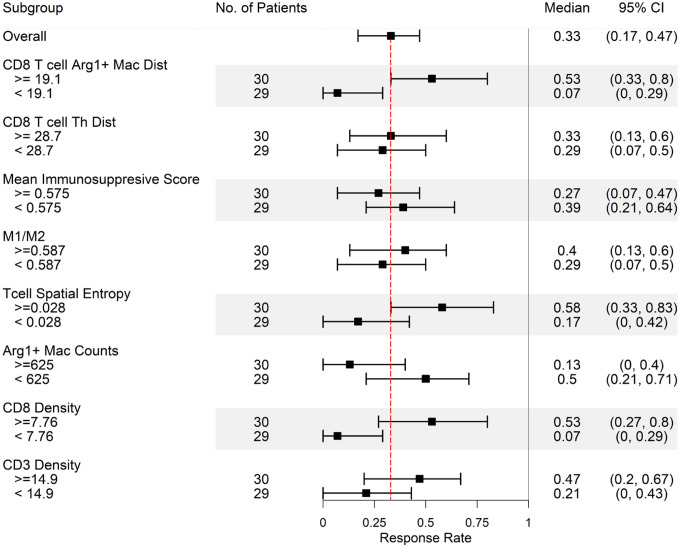
Fig 6. Biomarker identification at pretreatment stage.
Application of the spQSP model for biomarker identification based on the pre-treatment composition of the HCC tumor microenvironment. Virtual patients are divided into upper half and lower half the day 0 values of 8 different features. Simulated median response rates (90% cancer cell reduction in the ABM model) at day 70 after treatment of every subgroup are computed along with 95% bootstrapped confidence intervals.

