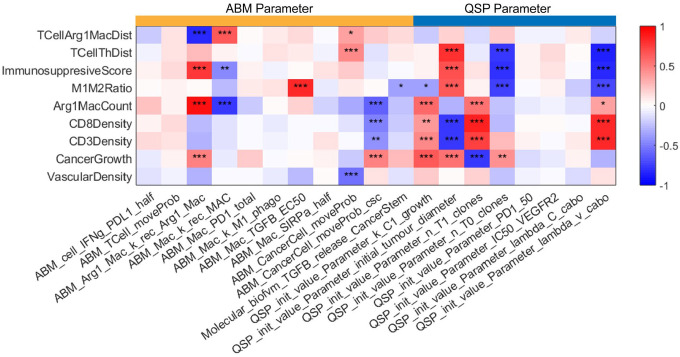
Fig 7. Sensitivity analysis.
The sensitivity analysis of 19 model parameters (11 ABM parameters and 8 QSP parameters) using the PRCC method (*: p < 0.05; **: p <0.01; ***: p<0.001), measuring the partial rank correlation coefficient (ranging from −1 to 1) between the model parameters (each column) and output variables (each row). Detailed biological interpretation of all model parameters is included in the supplemental materials.

