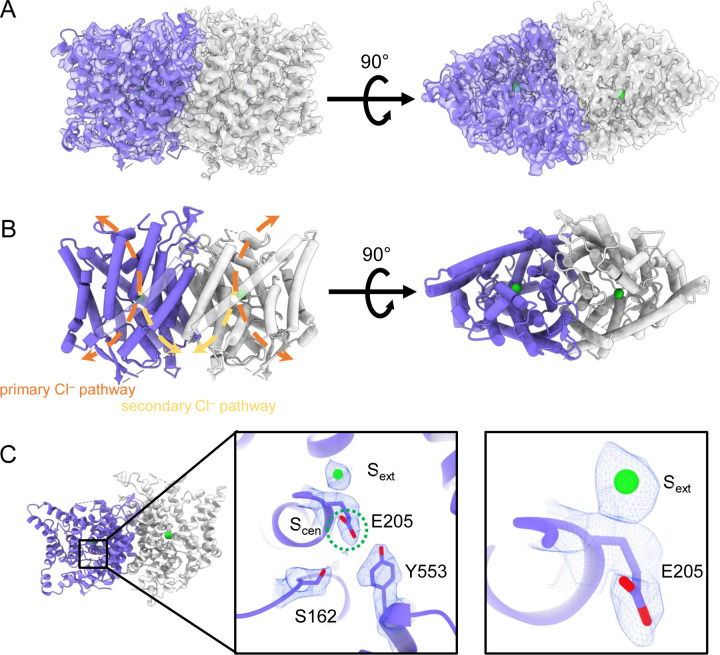
Figure 2. CryoEM structure of the human CLC-2 channel.
Overall structure of the transmembrane domain (“CLC2-TM”) at 2.46 Å. The identical subunits of the homodimer are shown in purple and gray, Cl− ions are shown as green balls. (A) cryoEM density map with model overlay (contour level: 0.71, 5.5 σ) and (B) model only with dashed arrows indicating the locations of pathways detected by Caver: orange, primary Cl− pathway common to all CLCs; yellow, secondary Cl− pathway detected in CLC-2 and CLC-1. Details of the pathways are presented in Figure 3. The secondary pathway, whose function is not yet known, was so named when first observed in the CLC-1 structure (Park and MacKinnon, 2018). (C) Zoomed-in views showing cryoEM density overlay of bound Cl− and key residues – Egate (E205) and inner-gate residues SerC (S162) and TyrC (Y553). Scen is indicated with a green dashed circle. Contour level: 1.1, 7.2 σ (middle panel); 0.97, 6.3 σ (right panel).

