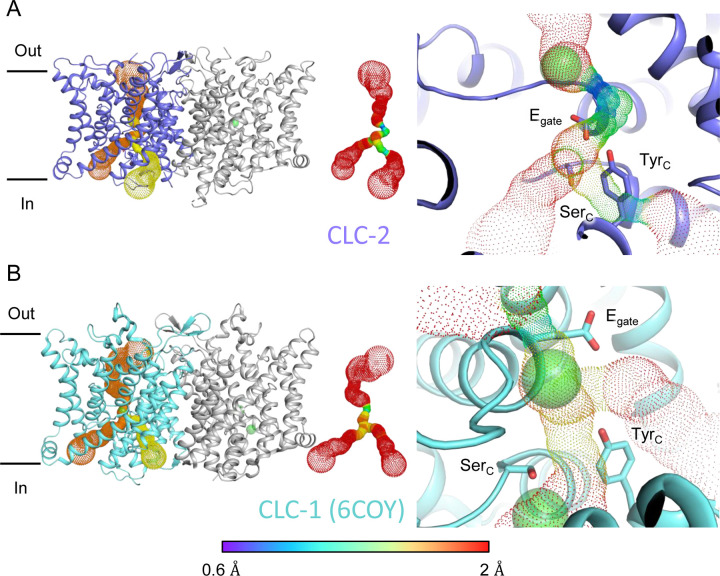
Figure 3.
Pore profile detected in CLC-2. (A) Left: The primary (orange) and secondary (yellow) pore detected in CLC-2 using Caver. Middle: The detected pore radii are displayed in dots as a color map. Right: Zoomed-in view of the restricted (narrowest) site of the pore profile, using the same coloring as in the middle panel. Egate, SerC and TyrC are shown as sticks. (B) Pore profile for CLC-1 (PDB ID:6coy), with display as in panel A.

