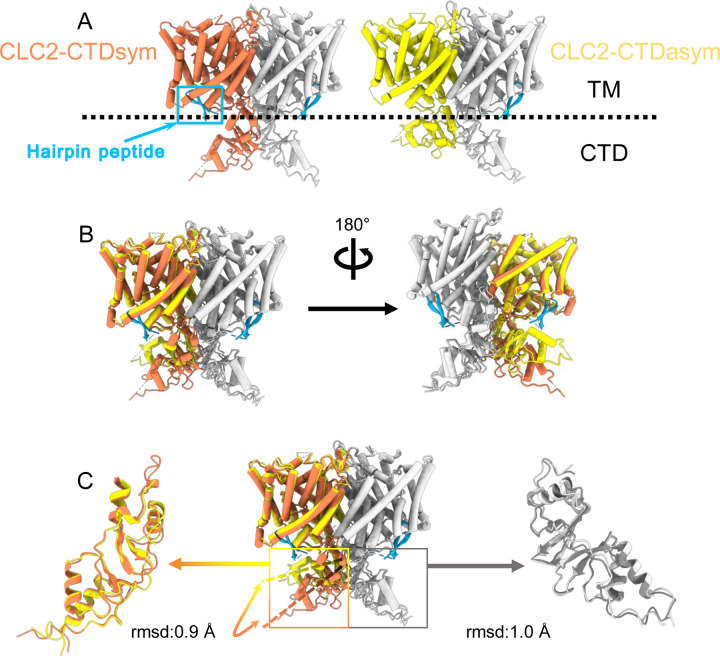
Figure 4. Different conformations of the CTD.
(A). Overall structure of the two CLC-2 conformations. Left: CLC2-CTDsym at 2.75 Å. Right: CLC2-CTDasym at 2.76 Å. The subunits of the homodimer are shown in orange (CLC2-CTDsym) or yellow (CLC2-CTDasym) and gray (for both). The subunits adopting different CTD conformations are shown in orange and yellow, while the subunits sharing the same CTD conformation are shown in gray. The dashed line demarcates the transmembrane (TM) and cytoplasmic (CTD) domains. A hairpin structure detected at the intracellular pore is shown in blue. (B) Overlay of two conformations. (C) Hinge movement of the CTD between two conformations. The middle panel shows an overlay of CLC2-CTDsym (orange and gray) and CLC1-CTDasym (yellow and gray), with the CTDs highlighted in boxes. For the subunits that adopt different conformations (orange and yellow), the double-headed arrow indicates the change between the two conformations. The RMSD between the subunits shown in orange/yellow is 6.9 Å, while the RMSD for the subunits shown in gray is only 1.3 Å. Alignments of only the CTDs are shown at left and right; in these alignments, the low RSMD values (0.9 Å and 1.0 Å, respectively) indicate that the CTDs undergo a hinge movement.

