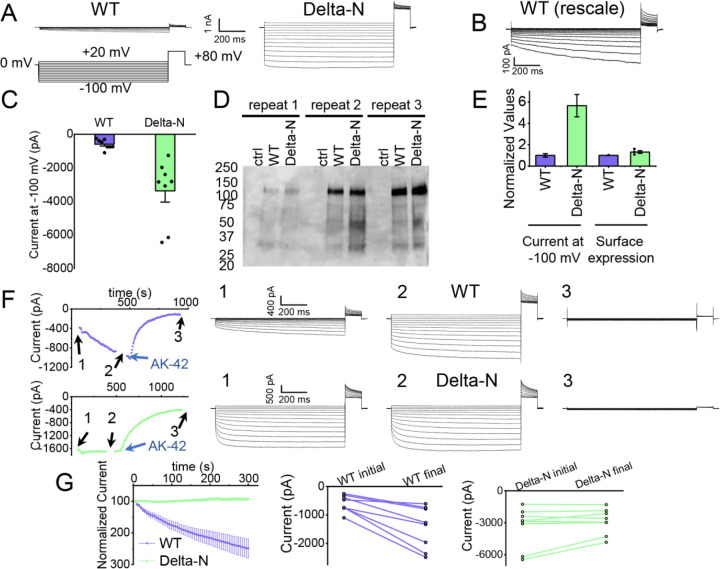
Figure 6. Patch-clamp experiments support CLC-2 channel block by the N-terminal hairpin structure.
(A) Representative currents from WT and Delta-N CLC-2, recorded using the whole-cell patch clamp configuration in response to the voltage protocol shown. (B) WT CLC-2 recording from panel A, shown on an expanded scale. (C) Summary of current levels measured for WT and Delta-N CLC-2 at the end of the 1-s voltage pulse to −100 mV. Data are from six independent transfection samples, in each case with WT and Delta-N recorded on the same day following transfection. WT: −600 ± 102 pA (SEM, n=8);Delta-N: −3300 ± 630 pA (SEM, n=8). (D) Western blot detection of biotinylated surface-expressed CLC-2 from three independent experiments. (E) Summary data for electrophysiology and surface-biotinylation experiments. Points representing individual experiments for Delta-N surface biotinylation (each normalized to WT) are shown. Individual data points for the electrophysiology experiments are shown in panel C. (F) Representative examples of experiments to evaluate current run-up in WT and Delta-N CLC-2. Left panels: Time course data. Following an initial voltage-family measurement (I-V protocol as in panel A, taken at point “1”), currents were monitored by 1-s pulses to −100 mV every 5 s for five minutes, after which a second voltage-family measurement was made (point 2), followed by application of AK-42 to facilitate leak subtraction, and a final voltage-family measurement at point 3. I-V traces are shown at right. (G) Summary data for “run-up” experiments. Left panel: Normalized time-dependent currents for WT and Delta-N. Currents were first leak-subtracted (using the steady-state current after AK-42 application) and then normalized to the amplitude of the current measured in the first step of the 5-minute sequence. Right panels: Leak-subtracted current levels at −100 mV from “initial” and “final” IV traces measured at points “1” and “2’ in the time course (panel F). Average initial and final currents (pA ± SEM, n=8) are WT: −600 ± 102 and −1400 ± 260; Delta-N: −3300 ± 630 and −2900 ± 420).

