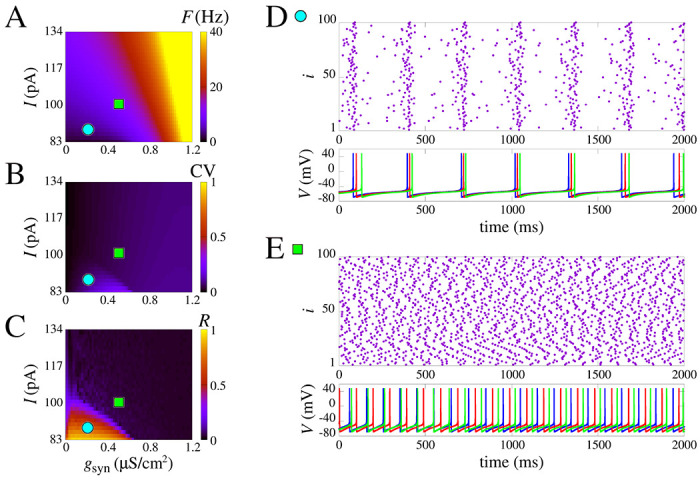
Figure 3: Spike synchronization in space parameters as a function of and synaptic conductance .

(A) Mean firing frequency. (B) Coefficient of variation, and (C) is the mean order parameter. (D) and (E) show the raster plot and the neuronal membrane potentials for the parameter indicated in A-C. (D) shows synchronized spikes for the parameters and . (E) shows desynchronized spikes for the parameters and . We use the model without slow potassium and calcium currents, i.e. .
