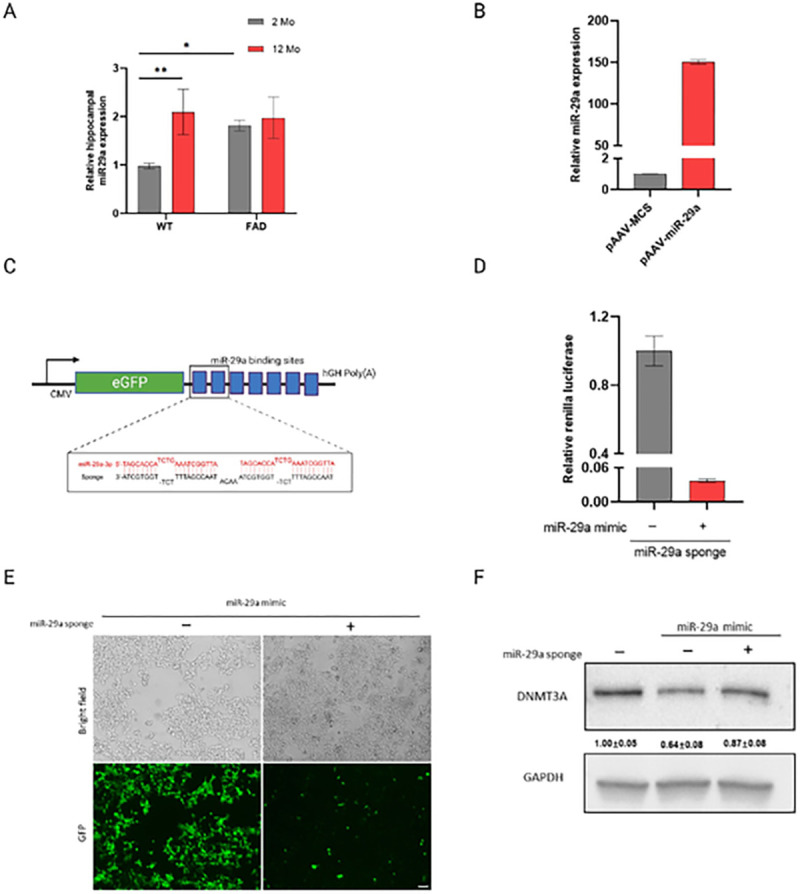
Figure 1.

miR-29a expression in mouse hippocampus and miR-29a sponge validation in vitro. A) miR-29a was determined in the hippocampus of 2 and12-month-old 5XFAD and WT mice by real-time RT-PCR. U6 snRNA was used as the endogenous control. Data was analyzed via Two-way ANOVA (age by genotype) with Sidak’s post hoc tests. Bars are mean ± standard deviation (SD) with n=3 per group; *p<0.05, **p<0.01. B) Relative expression level of mature miR-29a in HEK-293T cells transfected with miR-29a mimic (pAAV-miR-29a) and control vector (pAAV-MCS).C) Schematic representation of miR-29a sponge mechanism and design. Sponge sequence was shown as black color and target miRNA was shown as red. D)Renilla luciferase activity was assayed relative to firefly luciferase activity in 293T cells transfected with psiCHECK2 vector containing miR-29a sponge and miR-29a mimic (pAAV-miR-29a) or control vector (pAAV-MCS). E) Cell morphology and GFP expression upon transfection of miR-29a mimic (pAAV-miR-29a) with pAAV-GFP vector containing miR-29a sponge or empty vector (pAAV-GFP), as observed by light and fluorescent microscopy. Scale bars represent 100 μm. F) Western blot analysis of DNMT3A upon transfection of miR-29a mimic with or without miR-29a sponge. Experiments were performed 3 times and one representative western blot is shown. Quantification of western blots is provided under each blot. Data represents fold change relative to no treatment group ± SD. GAPDH was used as a loading control.
