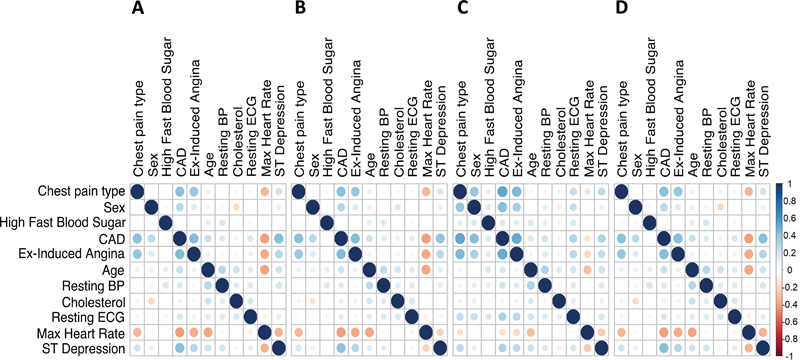
Fig. 1.

Correlation plots for the Cleveland Clinic data. ( A ) Correlation matrix for the original data; ( B ) mean correlation matrix of 500 datasets simulated by Mock Data Generation (modgo); ( C ) mean correlation matrix of 500 simulated dataset produced by modgo when it used the correlation matrix estimated by sbgcop as an intermediate covariance matrix; ( D ) mean correlation matrix of 500 simulated dataset by SimMultiCorrData. BP, blood pressure; CAD, coronary artery disease; ECG, electrocardiogram.
