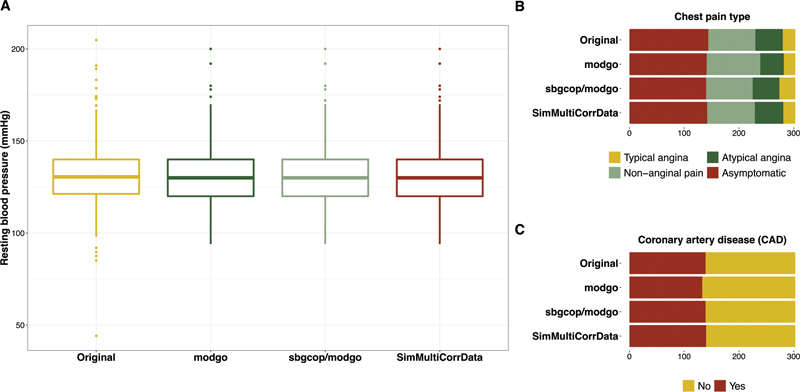
Fig. 3.

Distributions of one continuous, one ordinal and one dichotomous variable from the Cleveland Clinic data for the original data, and single simulated datasets obtained from Mock Data Generation (modgo), the combination of modgo and sbgcop, and SimMultiCorrData. ( A ) Box plot of the continuous variable resting blood pressure (mmHg); ( B ) bar plot for chest pain type, an ordinal variable with four categories; ( C ) bar plot for the dichotomous variable coronary artery disease (CAD).
