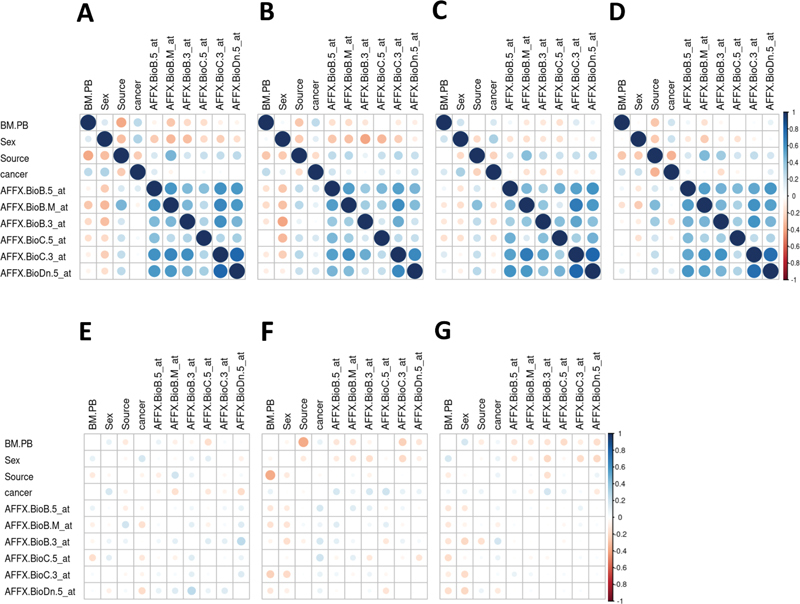
Fig. 5.

Correlation plots for the Golub data and difference between the correlation matrix estimated from the original data and the mean correlation matrix estimated by 500 runs of Mock Data Generation (modgo). ( A ) Correlation matrix for the original data; ( B ) mean correlation matrix of 500 datasets simulated by modgo; ( C ) mean correlation matrix of 500 datasets simulated by modgo, when all correlations were estimated with the Pearson correlation coefficient; ( D) mean correlation matrix of 500 datasets simulated by modgo, when a large tolerance of 10 is used for generating the normally distributed random variables was used; ( D ) mean correlation matrix of 500 datasets simulated by modgo; ( E ) difference between the correlation matrix estimated from the original data and the mean correlation matrix estimated by 500 runs of modgo; ( F ) difference between the correlation matrix estimated from the original data and the mean correlation matrix estimated by 500 runs of modgo, when correlations were estimated using Pearson correlation; ( G ) difference between the correlation matrix estimated from the original data and the mean correlation matrix estimated by 500 runs of modgo, when a large tolerance was used in generating the normally distributed random variables.
