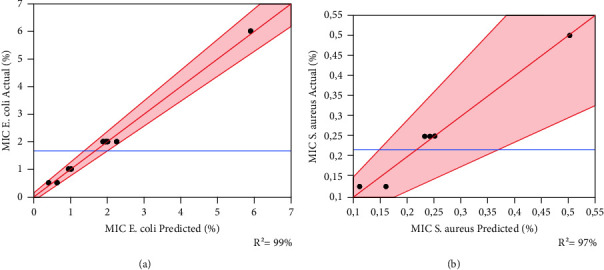
Figure 3.

Curves of the observed values according to the predicted values for the two studied responses (a) E. coli and (b) S. aureus. The red lines show the curve of actual values of MIC as a function of those predicted for both tested strains. The blue horizontal lines indicate the mean of the observed values.
