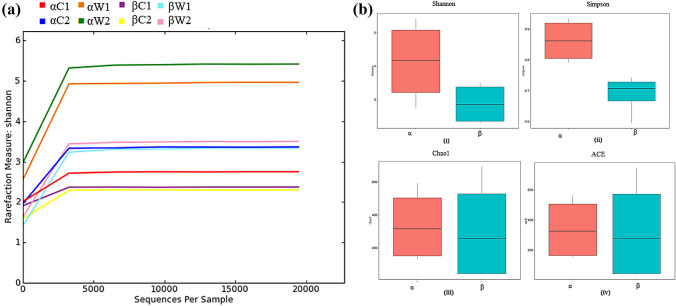
Fig. 1.
Comparative rarefaction curves and alpha diversity of gut and water samples based on Shannon, Simpson, Chao 1, ACE indices. a Rarefaction curve indicated the sequencing depth of eight samples; C. carpio gut samples (αC1, αC2) and water samples (αW1, αW2) from polluted site-α; as well as C. carpio gut samples (βC1, βC2)and water samples (βW1, βW2) from the less polluted site-β; b Boxplots illustrated deviations in alpha diversity between the polluted (site-α) and less polluted (site-β). These deviations were assessed using four indices: (i) Shannon index, (ii) Simpson index, (iii) chao1, (iv) ACE index. Significance testing was conducted using the Kruskal–Wallis test (p > 0.05), revealing a relationship between the standard deviations of the alpha diversity values

