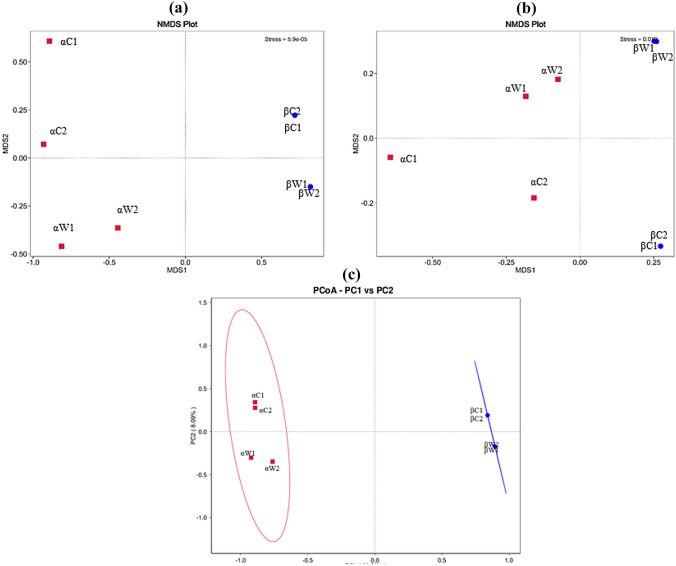
Fig. 2.
The microbial community differences among gut samples of fish and water samples were visualized using non-metric multidimensional plot (NMDS) and principal coordinate analysis (PCoA). The stress values for the NMDS plot were 5.9e–05; 0.019 indicating a good representation of the data. The dots on the plot were color-coded, with red representing samples from polluted site (site-α) and blue representing samples from less polluted site (site-β). The pairwise distances between these samples were determined using both a weighted and b unweighted UniFrac algorithms; c Principal coordinate analysis (PCoA) was performed using the weighted UniFrac algorithm. In the NMDS plot and PCoA, the gut and water samples from the polluted site (site-α) clustered together, while the samples from less polluted site (site-β) formed a separate group. This clustering indicates significant differences in bacterial composition between the two sites, and this analysis was conducted using R (v-3.7) software

