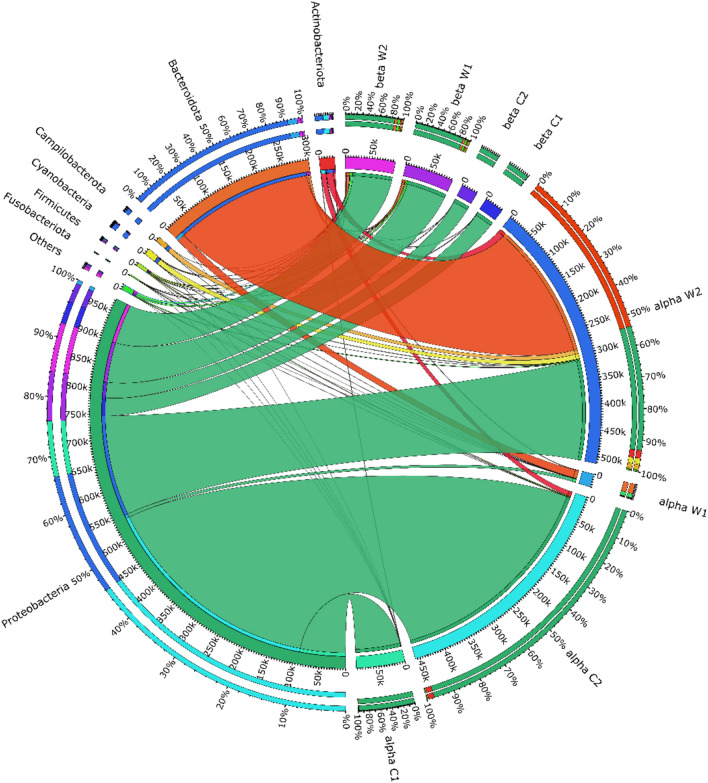
Fig. 3.
Microbial community’s abundance at the phylum level was assessed using Circos (v0.63-10). The analysis involved mapping eight samples based on their abundances, which were depicted in the outer circle, while the inner circle represents the synteny with the respective phyla. In the gut samples from site-α, Proteobacteria (97.7%) and Actinobacteria (1.2%) were enriched, whereas site-β exhibited dominance of Proteobacteria (98.5%), Fusobacteria (1.04%), and Firmicutes (0.3%). In the water samples, Bacteroides (60.5%); Proteobacteria (31.1%), Actinobacteria (3.6%), and Cyanobacteria (2.3%) in site-α. For site-β, the water samples were enriched in Proteobacteria (85.8%), Planctomycetes (12.03%), Bacteroidota (4.4%), and Verrucomicrobiota (3.7%)

