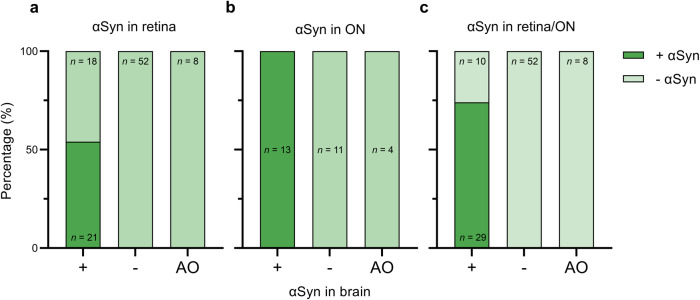
Fig. 3. Presence of αSyn pathology in the retina and optic nerve in cases with αSyn pathology in the brain, cases without αSyn pathology in the brain and amygdala-only αSyn pathology.
Shown is the percentage of cases with αSyn pathology (dark green indicates presence, light green indicates absence) in a retina, b optic nerve and c retina/optic nerve combined in cases with (+), without (−) and amygdala-only (AO) αSyn pathology in the brain. a 54% of the cases with αSyn pathology in the brain (+) showed αSyn pathology in the retina versus 0% of the cases without αSyn pathology in the brain (−) or with amygdala-only (AO) αSyn pathology. b Of cases with optic nerve tissue available (n = 28), all clinicopathological α-synucleinopathies (+; n = 13) showed αSyn pathology in the optic nerve as opposed to none of the other cases (n = 15). c Of the cases with αSyn in the brain ranging from brainstem-predominant to neocortical, 74% showed αSyn pathology in the retina/optic nerve. All cases without αSyn in the brain (−; n = 52) showed the absence of αSyn pathology in the retina/optic nerve, as did the cases with amygdala-only αSyn pathology (AO; n = 8). ON optic nerve, AO amygdala-only, n number.

